Task: Fine-tuning Large Language Models (LLMs) for PET Report Summarization and Comparative Performance Evaluation of their ability to generate automated personalized impressions from whole-body clinical PET reports that are acceptable to physicians
Rationale: Large language models (LLMs) have shown promise in accelerating radiology reporting by summarizing clinical findings into impressions. However, automatic impression generation for whole-body PET reports presents unique challenges and has received little attention. The developers of this automated-personalized-impressions-from-PET-radiology-reports framework aimed to evaluate whether a set of selected open-source LLMs fine-tuned on a large corpus of PET clinical reports can produce clinically useful personalized impressions for PET reporting that are acceptable to physicians.
Description: Twelve open-source language models were fine-tuned on a corpus of 37,370 retrospective PET reports collected from University of Wisconsin Radiology Department. All models were trained using the teacher-forcing algorithm, with the report findings and patient information as input and the original clinical impressions as reference. An extra input token encoded the reading physician’s identity, allowing models to learn physician-specific reporting styles.
In this evaluation framework, both encoder-decoder and decoder-only language models were assessed. Considering their different architectures, input templates were customized as illustrated in the figure below.

Formatting of reports for input to encoder-decoder and decoder-only models. For encoder-decoder models, the first two lines describe the examination category and encode the reading physician’s identity. “Findings” contains the clinical findings from the PET report, and “Indication” includes the patient’s background information. For decoder-only models, each case follows a specific format for the instruction: “Derive the impression from the given [description] for [physician]”. “Input” accommodates the concatenation of clinical findings and patient information. The output always starts with the prefix “Response:”. Both model architectures utilize the cross-entropy loss to compute the difference between original clinical impressions and model-generated impressions
For encoder-decoder models, the first lines describe the categories of PET scans, while the second lines encode each reading physician’s identity using an identifier token. The “Findings” section contains the clinical findings from the PET reports, whereas the “Indications” section encompasses relevant background information, including the patient’s medical history and the reason for the examination. For decoder-only models, we employed the instruction-tuning method [Ext. Ref.] and adapted the prompt from [Ext. Ref.]. Each case starts with the instruction: “Derive the impression from the given [description] report for [physician].” The PET findings and background information are concatenated to form the “Input” section. The original clinical impressions are used as the reference for model training and evaluation.
The specific task of LLMs coparative performance evaluation can be formulated as an abstractive summarization task since physicians typically interpret findings in the impression section, rather than merely reusing sentences from the findings section. Eight encoder-decoder models and 4 decoder-only models were fine-tuned, covering a broad range of open-source language models for sequence generation. The encoder-decoder models comprised state-of-the-art (SOTA) transformer-based models, namely BART [Ext. Ref.], PEGASUS [Ext. Ref.], T5 [Ext. Ref.] and FLAN-T5 [Ext. Ref.]. These models differ primarily in their pretraining objectives. BART was pretrained as a denoising auto-encoder, aiming to reconstruct original texts from corrupted samples. PEGASUS employed the gap sentence prediction objective, masking key sentences from documents and forcing the model to recover them based on the remaining sentences. T5 used the span-mask denoising objective, involving masking out contiguous spans of text and challenging the model to predict these masked spans. FLAN-T5, in comparison to T5, underwent further instruction fine-tuning in a mixture of tasks. To investigate if the medical-domain adaptation could benefit the evaluation task, 2 biomedical LLMs were fine-tuned, namely BioBART [21] and Clinical-T5 [22]. BioBART was pretrained on the PubMed dataset, while Clinical-T5 was trained using the MIMIC-III dataset [23]. Additionally, 2 baseline models were included, namely the pointer-generator network (PGN) [3] and BERT2BERT [24], which were considered as the previous SOTA methods in radiology impression generation.
The decoder-only models encompassed GPT2 [Ext. Ref.] and OPT [Ext. Ref.] as well as LLaMA [Ext. Ref.] and Alpaca [Ext.Ref.]. All these models are built on the transformer architecture and have been pretrained on vast text corpora for next token prediction.
All twelve language models were trained using the standard teacher-forcing algorithm. The training objective can be written as a maximum likelihood problem:
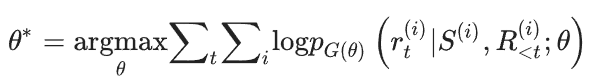
where θ denotes the parameters of model G, p_G(θ) estimates the probability of the next word r_t given the previous sequence R_<t in the reference text and the source text S. Superscript t denotes the word position in the reference text and i denotes a single sample. The AdamW optimizer [Ext. Ref.] was used to optimize this log-likelihood loss. LLaMA and Alpaca were fine-tuned with low-rank adaptation (LoRA) [Ext.Ref.] to allow for training on consumer-level GPUs like NVIDIA A100s, while the other models were subjected to full fine-tuning. The beam search decoding algorithm was adopted to generate impressions and set the number of beams to 4. The model weights are made available on Hugging Face while the open-source code can be found in GitHub.
Evaluation: To compare the performances of different models, various automatic evaluation metrics were computed and benchmarked against physician preferences. First the open-source LLM model that performed best at the PET summarization task was determined. This involved adapting multiple LLMs to the PET domain, benchmarking 30 automatic evaluation metrics against physician preferences, and subsequently using the benchmarked metrics to select the most proficient fine-tuned LLM. Then, an expert reader study was conducted to assess the quality of LLM-generated impressions from the perspective of reading physicians, focusing on the clinical utility, common mistakes, and the importance of tailoring impressions to physician-specific reporting styles. External testing of the LLM was also performed. As an additional evaluation, the LLM’s reasoning capability was assessed within the nuclear medicine (NM) domain by measuring its accuracy in predicting Deauville scores for PET lymphoma reports.
Results: To identify the evaluation metrics most correlated with physician preferences, we presented impressions generated by 4 different models (PGN, BERT2BERT, BART, PEGASUS) to two NM physicians. These models represented a wide performance spectrum. One physician (M.S.) reviewed 200 randomly sampled reports in the test set, then scored the quality of model-generated impressions on a 5-point Likert scale (5 best, 1 worst). The definitions of each level are given in the table below. To assess inter-observer variability, a second physician (S.Y.C.) independently scored 20 of the cases based on the same criterion.
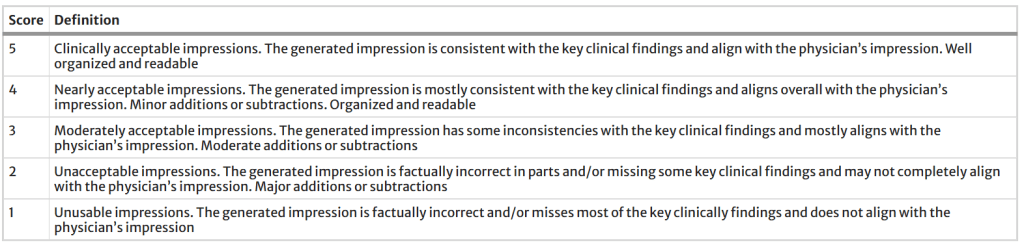
Definition of the 5-point Likert scale for evaluating the quality of model-generated impressions
The table below categorizes the evaluation metrics included in the performance evaluation study. To address the domain gap between general-domain articles and PET reports, BARTScore was fine-tuned on the supplied PET reports using the method described in [Ext. Ref.] and was then named BARTScore + PET. Following the same approach, PEGASUSScore + PET and T5Score + PET was also developed. Unlike the LLMs for impression generation, these three evaluators (available here) estimated the semantic similarity between generated impressions and their respective references. The Spearman’s ρ correlation quantified how well evaluation metrics correlated with the physicians’ judgments. Metrics with the highest correlations were used to determine the top-performing model.
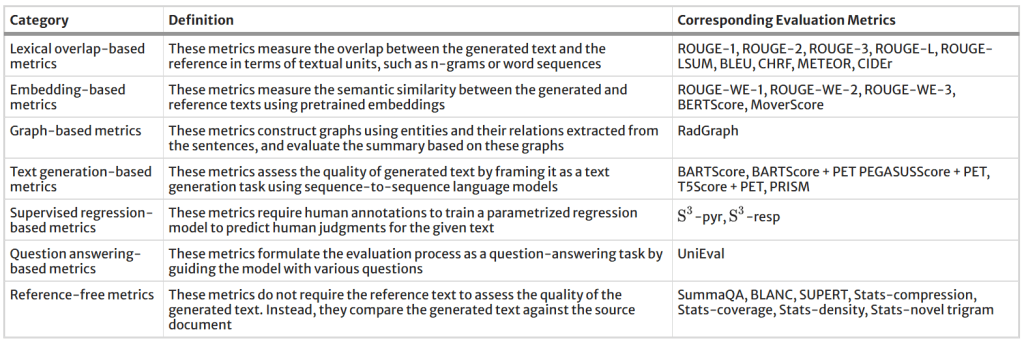
All evaluation metrics included in this study and their respective categories
Following the above procedures, eventually PEGASUS open-source LLM was determined as the top-performing LLM for the evaluated task. To evaluate its clinical utility, three nuclear medicine physicians assessed the PEGASUS-generated impressions and original clinical impressions across 6 quality dimensions (3-point scales) and an overall utility score (5-point scale). Their definitions are described in the table below. Each physician reviewed 12 of their own reports and 12 reports from other physicians. The application we designed for physician review of test cases can be accessed here.
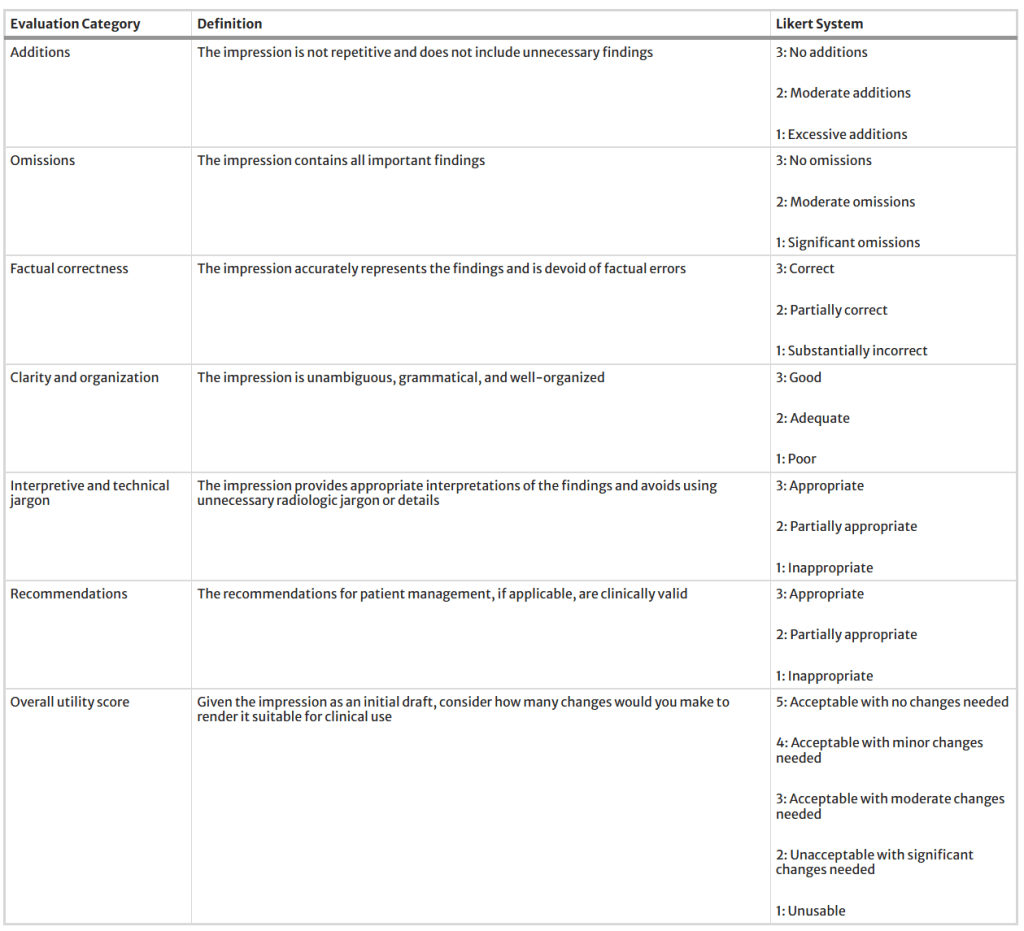
Definitions of six quality dimensions and an overall utility score used in our expert evaluation, along with their corresponding Likert systems
The figure below shows the Spearman’s ρ correlation between evaluation metrics and quality scores assigned by the first physician (M.S.). BARTScore + PET and PEGASUSScore + PET exhibited the highest correlations with physician judgment (ρ = 0.568 and 0.563, P = 0.30). Therefore, both metrics were employed to determine the top-performing model for expert evaluation. However, their correlation values were still below the degree of inter-reader correlation (ρ = 0.654). Similar results were observed in the correlation between evaluation metrics and the second physician’s scores. Without adaption to PET reports, the original BARTScore showed lower correlation (ρ = 0.474, P < 0.001) compared to BARTScore + PET, but still outperformed traditional evaluation metrics like Recall-Oriented Understudy for Gisting Evaluation-L (ROUGE-L, ρ = 0.398, P < 0.001) [Ext. Ref.].
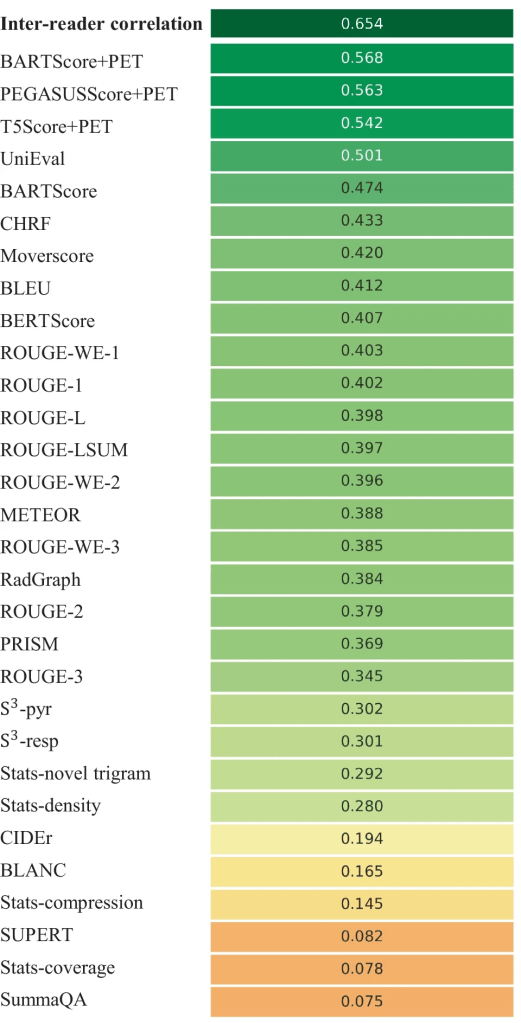
Spearman’s ρ correlations between different evaluation metrics and quality scores assigned by the first physician. The top row quantifies the inter-reader correlation. Domain-adapted BARTScore (BARTScore + PET) and PEGASUSScore (PEGASUSScore + PET) demonstrate the highest correlations with physician preferences
The metrics commonly used in radiology report summarization, including ROUGE [Ext. Ref.], BERTScore [Ext. Ref.] and RadGraph [Ext. Ref.], did not demonstrate strong correlation with physician preferences. Additionally, most reference-free metrics, although effective in general text summarization, showed considerably lower correlation compared to reference-dependent metrics.
The figure below illustrates the relative performance of 12 language models assessed using all evaluation metrics considered in this study. For better visualization, metric values have been normalized to [0, 1]. The SOTA encoder-decoder models, including PEGASUS, BART, and T5, demonstrated similar performance across most evaluation metrics. Since BARTScore + PET and PEGASUSScore + PET identified PEGASUS as the top-performing model, we selected it for further expert evaluation.
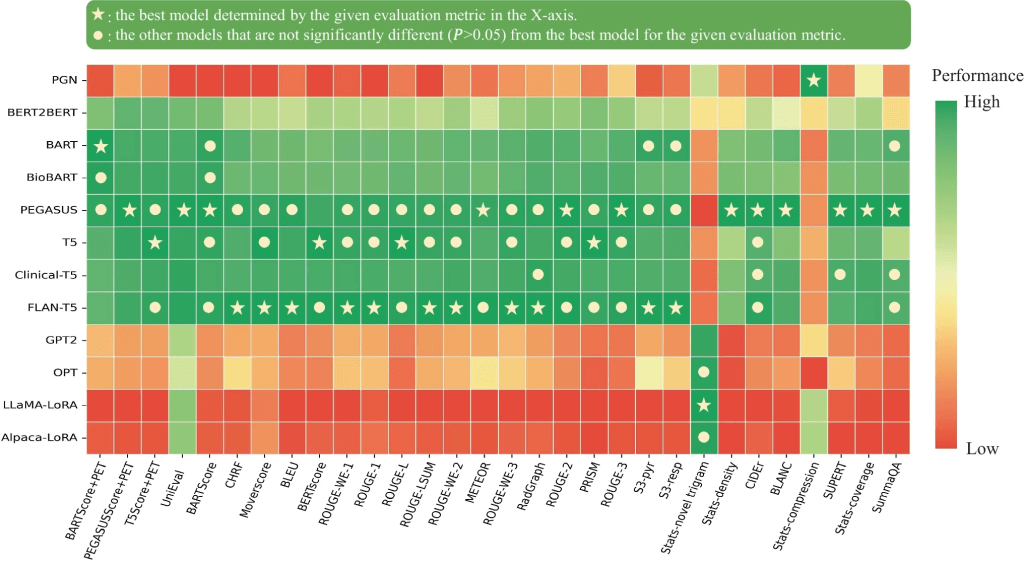
Performance of 12 language models evaluated by the metrics included in this study. The X-axis displays the metrics arranged in descending order of correlation with physician preferences, with higher correlations on the left and lower correlations on the right. For each evaluation metric, values underwent min–max normalization to allow comparison within a single plot. The actual metric values are referenced in Appendix 5. The star denotes the best model for each metric, and the circle denotes the other models that do not have statistically significant difference (P > 0.05) with the best model
After being fine-tuned on the supplied PET reports, the medical knowledge enriched models, BioBART (BARTScore + PET: -1.46; ROUGE-L: 38.9) and Clinical-T5 (BARTScore + PET: -1.54; ROUGE-L: 39.4), did not show superior performance compared to their base models, BART (BARTScore + PET: -1.46; ROUGE-L: 38.6) and T5 (BARTScore + PET: -1.52; ROUGE-L: 40.3). Additionally, the four decoder-only models included in this evaluation study showed significantly lower performance (P < 0.001) compared to the top-tier encoder-decoder LLMs. Interestingly, LLaMA-LoRA (BARTScore + PET: -2.26; ROUGE-L: 27.2) and Alpaca-LoRA (BARTScore + PET: -2.24; ROUGE-L: 28.0), which have been pretrained on one trillion tokens, did not surpass the performance of GPT2 (BARTScore + PET: -2.04, ROUGE-L: 28.7) and OPT (BARTScore + PET: -2.07, ROUGE-L: 28.3).
The distributions of overall utility scores and 6 specific quality scores are illustrated in the figure below. Each plot compares four types of impressions: original clinical impressions dictated by the physicians themselves (Orig., own), PEGASUS-generated impressions in the physician’s own style (LLM, own), original clinical impressions dictated by other physicians (Orig, other), and PEGASUS-generated impressions in other physicians’ styles (LLM, other). In total, 83% (60/72) of the PEGASUS-generated impressions were scored as clinically acceptable (scores 3–5), with 60% (43/72) scoring 4 or higher, and 28% (20/72) receiving a score of 5.
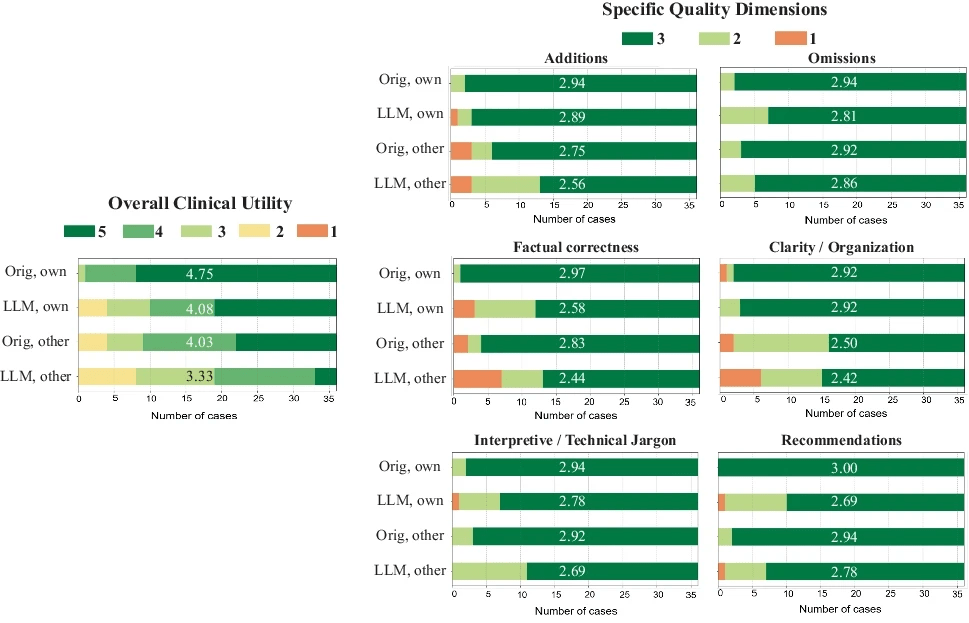
Expert evaluation consisting of an overall utility score and 6 specific quality dimensions. “Orig, own”: original clinical impressions from the physician’s own reports; “LLM, own”: PEGASUS-generated impressions for the physician’s own reports; “Orig, other”: original clinical impressions from other physicians’ reports; “LLM, other”: PEGASUS-generated impressions for other physicians’ reports. The average score for each group is provided to highlight the differences
When physicians assessed LLM impressions generated in their own style, 89% were considered clinically acceptable, with a mean utility score of 4.08/5. On average, physicians rated these personalized impressions as comparable in overall utility to the impressions dictated by other physicians (4.03, P = 0.41).
Regarding Deauville Scores (DSs) Prediction performance., of the 4,000 test cases, 405 PET lymphoma reports contained DSs in the impression sections. The table below presents the DS classification results for all evaluated models. PEGASUS achieved the highest 5-class accuracy (76.7%, 95% CI, 72.0%, 81.0%). Among decoder-only models, GPT2 demonstrated the best performance, with an accuracy of 71.3% (95% CI, 65.8%, 76.4%).
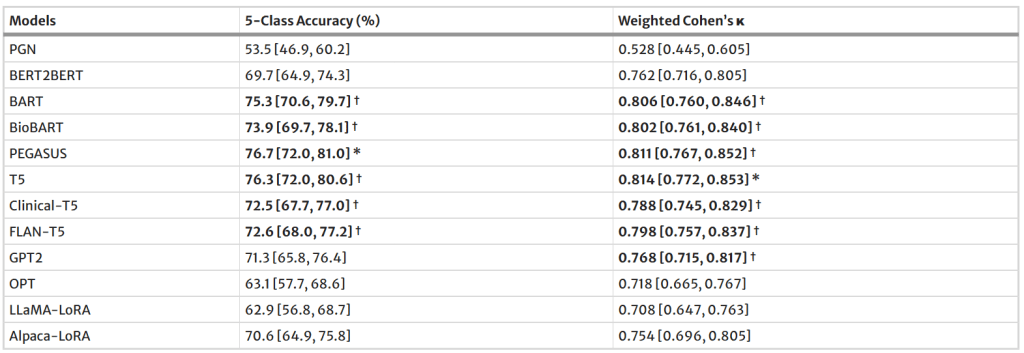
Performance of 12 language models on Deauville score prediction
Regarding external testing, when PEGASUS was applied to the external test set, a significant drop (P < 0.001) was observed in the evaluation metrics, as shown in the table below. Averaged across the reporting styles of Physicians 1, 2, and 3, BARTScore + PET in the external set was 15% worse than in the internal test set (internal vs. external: -1.47 vs. -1.69, P < 0.001). Similarly, ROUGE-L decreased by 29% in the external set (40.0 vs. 28.5, P < 0.001).
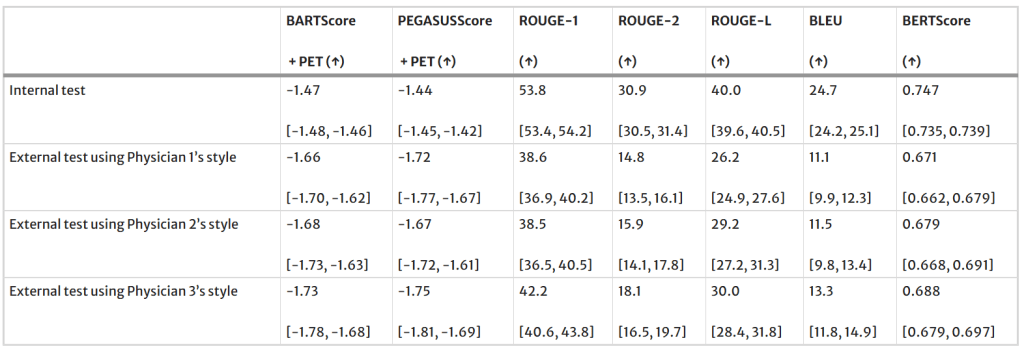
Performance of PEGASUS in the external test set
Claim: The evaluation study demonstrated that personalized impressions generated by PEGASUS were clinically useful in most cases, highlighting its potential to expedite PET reporting by automatically drafting impressions.
Remarks: This study had several limitations. First, when fine-tuning LLaMA and Alpaca, only a lightweight domain adaptation method, namely LoRA, was investigated which was constrained by computational resources. Second, the authors’ current model generates impressions based solely on reporting findings and patient information. However, the PET images themselves could be used to fact-check the generated impressions using vision-language modeling. Third, the number of reports assessed in this reader study was not large enough. Each physician reviewed only 24 reports due to the difficulty of the task. For most cases, scoring impressions took 15–20 min per report. Considering practical limitations in physician time, the authors decided to have multiple readers so that more reports (N = 72) can be evaluated. Lastly, their training dataset was restricted to a single institution. Future work should be expanding their research to a multi-center study.
Data Availability: The radiology reports used in this study are not publicly available due to privacy concerns related to HIPAA. However, upon reasonable request and approval of a data use agreement, they can be made available for research purposes. COG AHOD1331 clinical trial data is archived in NCTN Data Archive
