Task: MR-PET medical image fusion based on unsupervised deep learning and a convolutional neural network.
Rationale: The fusion of magnetic resonance imaging and positron emission tomography can combine biological anatomical information and physiological metabolic information, which is of great significance for the clinical diagnosis and localization of lesions.
At present, the traditional methods for MR-PET medical image fusion are simple weighting [Ext. Ref.], multiresolution pyramids [Ext. Ref.], wavelet transform [Ext. Ref.], color space [Ext. Ref.], principal component analysis [Ext. Ref.], human visual systems [Ext. Ref.], etc. In the past decade, due to the emergence of large datasets and improvements in GPU computing power, the deep learning method, which does not rely on artificial features, has achieved great success in the field of image processing. Recently, deep learning has become a representative method of image fusion and a research hotspot. A variety of image fusion methods based on deep learning have been proposed in succession [Ext. Ref.], [Ext. Ref.], [Ext. Ref.]. Fusing images with deep learning is an effective solution, to pursue a better perception effect. The design of an image fusion model is mainly based on the definition of some more diverse design rules to enhance the transformation and fusion strategy.
At present, deep neural networks specifically designed for medical image fusion are still in their infancy. Corresponding methods that can be applied in hybrid PET/MR are even more rare. In order to achieve better model performance with limited data samples, medical image fusion typically requires consideration of specific clinical insights and imaging mechanisms (such as mechanisms and anatomical structures of different modalities), and the design of effective fusion strategies to integrate these different information sources, thereby fully utilizing these medical domain knowledge in the fusion process.
MdAFuse focus instead on extracting and preserving key features from MR and PET images. To achieve this, multi-dimensional feature models and an adaptive linear fusion strategy are designed. The model introduces a new concept for MR-PET medical image fusion based on unsupervised deep learning. First, a three-dimensional feature extraction module is established to extract the coarse, fine and multi-scale information features from a source image, and then the affine mapping function of multi-dimensional features is established to fuse the multi-dimensional features.
Description: MdAFuse model adopts a novel adaptive linear aproach for multi-dimensional features of brain magnetic resonance and positron emission tomography images based on a convolutional neural network. MdAFuse introduces the following three main novel contributions:
- proposes a kind of energy-based color enhancement algorithm to further enhance the visualization effect, mainly enhance the energy information from the original PET/SPECT images in the fused image. While using it to display abnormal areas in different time series of the same case, the evolution process of lesions (e.g., brain tumors) can be tracked better.
- multi-dimensional analysis of the image is divided into three modules to extract the coarse features, fine features and multi-scale features from the source images. The three modules focus on the importance of different information from source images and try to extract different levels of features, reduce the loss of features in the process of feature transfer, and improve the accuracy of subsequent feature fusion.
- the affine mapping function is established to maintain the geometric relationship between different dimension features, whose correlation coefficients are generated adaptively through the learning process. So that multi-dimension features including the spatial texture information of the MRI image and the functional metabolic information of the PET/SPECT image can be fully preserved in the fused image.
The developers of the MdAFuse model not only proposed a multi-modality image fusion network but also presented an energy-based visualization method and an adaptive linear fusion strategy, as illusterated in the figure below:
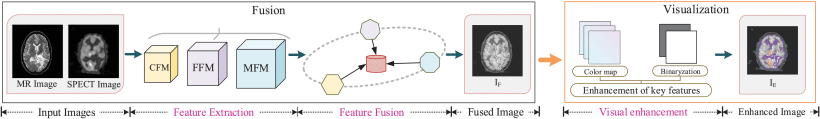
The flowchart of MdAFuse consists of two stages, i.e., image fusion and visualization enhancement. A novel CNN network is built to fuse a pair of MR-SPECT image to obtain a piece of high-quality fused image in the fusion stage. And in the visualization stage, a new color enhancement algorithm is proposed to further improve the visualization effect of the fused image.
Regarding feature extraction, the model tries to extract and preserve important information from the source MR and PET images as much as possible, adopting a multi-dimensional approach, making full use of spatial and channel features. Three modules are established, namely, the coarse feature module (CFM), the fine feature module (FFM) and the multi-scale feature module (MFM), to extract coarse feature information, fine feature information and multi-scale feature information, respectively. CFM is responsible for capturing the main shape structure and edge contour information of images, which belongs to key information for distinguishing tissue boundaries and lesion localization. FFM is responsible for capturing fine texture details, which belongs to key information for identifying lesion types. MFM is mainly designed to retrieve the complementary information between multi-scale images to achieve finer fusion.
As illustrated in the figure below, the specific feature extraction process is presented in the blue dotted line box. The small squares with different colors represent three steps (convolution operation, batch normalization and ReLU activation), different colored squares represent different sizes of convolution kernels, yellow is 1, blue is 3, green is 5, purple is 7 and pink is 3. Squares of different sizes represent different feature map sizes and the number of output channels. There is a definition of different channel numbers in the gray dotted box at the lower right corner of the figure, that is, squares with different widths represent the outputs of different channel numbers, and the darker the color is, the bigger the number of channels. For an input image, the feature extraction module will obtain three dimensions of features, namely, CF1 , FF1 and MF1 . These feature extraction modules are designed based on the perceptual characteristics of human visual perception and the physical properties of images.
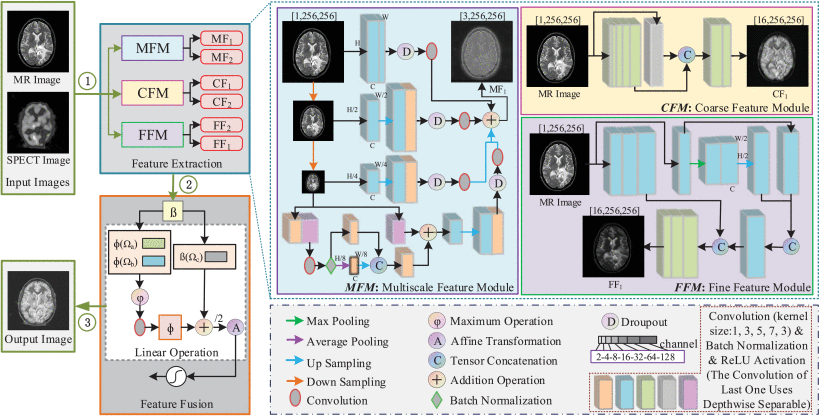
The framework of the proposed image fusion network, including feature extraction and feature fusion. The feature extraction consists of three modules: CFM (coarse feature module), FFM (fine feature module) and MFM (multi-scale feature module). The feature fusion adopts a adaptive linear mapping function to establish relationship between multi-dimensional features
CFM is represented by the area with a yellow background on the edge of the fuchsia solid line. CFM stands for coarse feature module, which is responsible for coarse feature extraction from images through convolution operations. It utilizes larger convolution kernels and smaller feature channels to capture the main shape structures and edge contour information of images, representing global low-frequency information such as image backgrounds and object contours. From the feature maps shown in the above figure, it can be observed that the CF feature map extracted by the CFM module exhibits clearer contours. Similarly, FFM is denoted by the area with a purple background on the edge of the blue solid line. FFM refers to the fine feature module, which focuses on fine feature extraction. This module employs smaller convolution kernels and larger feature channels to capture texture details such as object edges, fine texture details, and noise, representing local high-frequency information with significant variations within the images. The number of channels used for fine feature extraction is much greater than that used for coarse feature extraction. From the feature maps shown in above figure, it can be observed that the FF feature map extracted by the FFM module displays more distinct texture details.
MFM is the area in the above figure with blue background on the edge of purple. MFM mainly obtains the spatial structure from the idea of pyramid and classification to obtain the complementary information between multi-scale images and uses the complementary information between multiresolution and multi-scale images to achieve fine fusion. In the MFM, the deep separation convolution network is also used, which is convenient for mining more abundant and useful information and can provide a good foundation for subsequent image comprehension and application analysis. As in reference [Ext. Ref.] and [Ext. Ref.], the developers use a skip connection approach when implementing neural networks. In their design of the feature extraction module, they place more emphasis on local fine-grained information rather than global features. Using short skip connections facilitates the transmission and preservation of local information, enabling the network to better learn and utilize these localized characteristics. Therefore, short skip cascading is used in the process of feature extraction to obtain more detailed information, realize the gradual fusion of features.
MdAFuse extracts features from three dimensions, i.e., coarse, fine and multi-scale dimensions. The coarse features are mainly reflected in the edge contour information, while the fine features can retain the texture details. To obtain both high frequency information and low frequency information from an image, the coarse and fine features of each image are added to obtain the image features with more information. To highlight salient features in two images, especially highlighted information on PET/SPECT images (often corresponding to abnormal areas), the maximum value is considered to obtain the more prominent part. Multi-scale features can provide more structural information and can also compensate for missing local details at the cross scale. Therefore, the coarsest and finest features must be multi-scale. For each input, three features (CF, FF and MF) will be obtained. When two modal images are input, six features are extracted.
Programming and Data Environment: Python 3.7.9 and the Pytorch version of 1.7.1+ cu110 was used with its corresponding CUDA version of 11.1. GNU/Linux x86 in a GeForce RTX 3090 Ti GPU 20 GB RAM device-64 system. In the training, the data came from the Alzheimer’s Disease Neuroimaging Initiative were used, where 555 pairs of MR and PET images were obtained. The age of these samples ranges from 55 to 90 years, and the sex includes both male and female. All images were analyzed as axial slices with a voxel size of 1.0×1.0×1.0 mm3. Cross-validation is performed for the trained model by non-intersect test dataset. 137 pairs of medical images from the Whole Brain Atlas are obtained for testing. Among them, there are 74 pairs of MR-SPECT, 42 pairs of MR-PET, and 21 pairs of MR-CT.
Evaluation: In the fusion experiment of the following two figures, the test data were MR and SPECT brain images with glioma, which is a typical application in the brain nervous system. They are identified in the test dataset and respectively correspond to No. 010 and No. 029. Fusion of MRI and PET/SPECT can integrate biological anatomical information and physiological metabolic information, which can help doctors to locate and diagnose lesions. Several existing fusion algorithms based on traditional and deep learning methods are analyzed and compared.
Results: Three kinds of traditional fusion methods are tested and compared with the MdAFuse model. As illustrated in the first figure below, the first column and second column display the MR and SPECT source images, respectively, from some cases with brain abnormalities. The following columns show the results obtained by three traditional methods and MdAFuse, with one column for each method. In the same figures, we can observe the differences among the fused images from different fusion methods. PCF is a fusion method using wavelet transform, and the fused image has serious information loss. LatLrr is a low-rank representation method, and its fusion strategy is simple weighted average. The results of this method can maintain good texture details but less SPECT image information. atsIF (adaptive dual scale image fusion) [Ext. Ref.] is a fusion strategy through color space conversion, which can retain more SPECT information, but MR details are lost. Compared with other methods, MdAFuse can better preserve the information of the two source images. In the first line, three corresponding parts of each image inside three colorful squares are enlarged and shown in the 2nd, 3rd and 4th lines for clearer comparison.
The second line in the first figure below lists the enlarged images corresponding to the parts inside blue squares in the first line. In the last column, we mark three arrows pointing to the temporal lobe, basilar artery and pontine. The temporal lobe is gray and irregular in the MR image. SPECT shows a lighter gray circle with an obvious color difference. In the PCF results, the area is not obvious, and the features are completely retained on MR but not on SPECT. In the results of LatLrr fusion, the area can retain the information of the two source images but also loses part of the SPECT information, such as the pixel value around the temporal lobe, which is not different. The effect of the atsIF method is greatly improved in terms of brightness, which can retain more information in SPECT, but information loss occurs with the combined source image. Compared with other methods, MdAFuse can perfectly preserve the features of the temporal lobe region. For the basilar artery area, an obvious difference is also noted. In the MR image, the area is a small black ellipse, while in SPECT, it is an even gray area without shape features. PCF completely retains the information on MRI, LatLrr and MdAFuse show a dark gray color for this position area, and the shape is not changed. The fusion result of atsIF becomes a white area, and a black circle is evident outside the small ellipse. Arrow 3 points to the pontine area, which is an area with an uneven gray distribution on MR images and a small area with obvious brightness similar to triangle on SPECT images. Similarly, the feature information of SPECT cannot be found in the fusion results of PCF, and the brightness information of this location area is not obvious in the LatLrr and atsIF results. The features of MR and SPECT can be clearly viewed in the results of this method.
The third line in the first figure below lists the enlarged images corresponding to the parts inside purple squares in the first line. Similarly, in the last column, we mark four arrows pointing to the occipital lobe, occipital bone, lateral sinus and occipital lobe contour. From the display of the four arrows, it also proves that the fusion result of MdAFuse is better especially in the area of first arrow. The fourth line lists the enlarged images corresponding to the parts inside blue squares in the first line. The four arrows in the last column point to the temporal lobe, temporal muscle, pinna and lateral occipital bone. From the display of the four arrows, it also proves that the fusion result of MdAFuse is better.
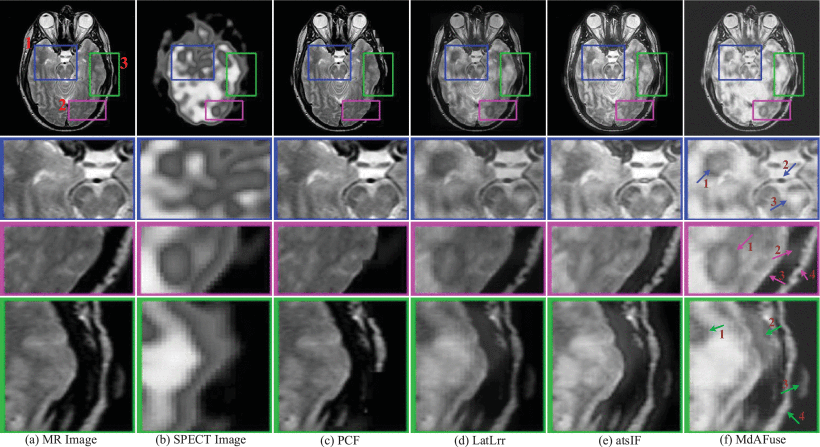
Fused results and their enlarged ROIs of the same pair of MR-SPECT images by some traditional fusion methods (PCF [Ext. Ref.], LatLrr [Ext. Ref.], atsIF [Ext. Ref.]) and the proposed fusion method (dataset No. 010)
Subsequently, experiments were conducted on several kinds of DL-based image fusion methods and their fusion results were copared agaisnt MdAFuse model. As illustrated in the figure below, the first and second columns show the MR and SPECT source images to be fused, and the following six columns show the fusion results obtained by six kinds of fusion methods, including MdAFuse. From these results, we can observe the differences among different fusion methods. Overall, it can be observed that the fusion images generated by U2Fusion and CDDFused seem not to consider the information of SPECT. While FusionDN and DeFusion methods preserve SPECT information in the fusion images, some loss of information can still be observed. The image fusion results from the FunFuseAn method are relatively better, showing visual similarity to MdAFuse in this paper. Therefore, we enlarged three small areas to further compare and analyze. In the first line, we use three colors to mark three different areas and enlarge them, as shown in the second to fourth lines.
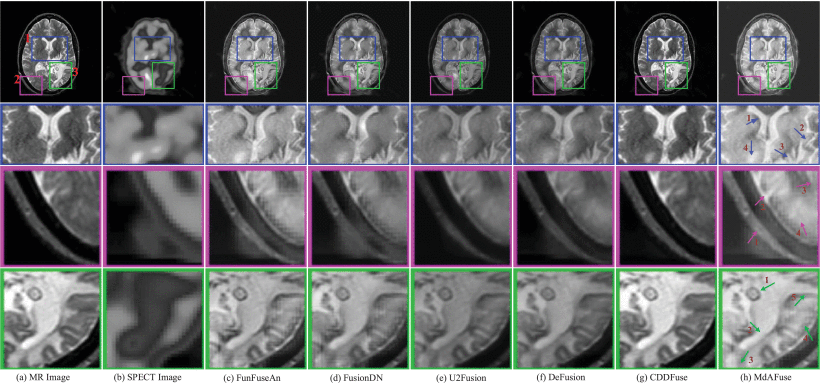
Performance Comparisons: The quality of our MdAFuse method is comparable to those of existing DL-based methods. From (c) to (h) are FunFuseAn [Ext. Ref.], FusionDN [Ext. Ref.], U2Fusion [Ext. Ref.], DeFusion [Ext. Ref.], CDDFuse [Ext. Ref.] and MdAFuse (dataset No. 029)
In order to quantitatively measure the results obtained from different fusion methods, we adopted nine kinds of quality evaluation metrics, i.e., information entropy (EN) [Ext. Ref.], mutual information (MI) [Ext. Ref.], standard deviation (SD) [Ext. Ref.], visual information fidelity (VIF) [Ext. Ref.], structural similarity (SSIM) [Ext. Ref.], sum of correlations of differences (SCD) [Ext. Ref.], correlation coefficient (CC) [Ext. Ref.], mean square error (MSE) [Ext. Ref.] and the ratio of spatial frequency error (rSFe) [Ext. Ref.]. For MSE, a smaller value signifies better performance. For rSFe, a smaller absolute value of rSFe corresponds to a better fusion effect. While other seven evaluation metrics are on the contrary. Among them, rSFe is a relatively uncommon evaluation metric, which is used to measure the overall activity level of the image, which consists of four spatial frequencies (row, column, main diagonal, secondary diagonal) and four first order gradients (horizontal, vertical, main diagonal, secondary diagonal) in pixel points. The smaller the absolute value of this index is, the better the fusion effect is. For the convenience of comparison and analysis, the calculation results of some metrics were normalized.
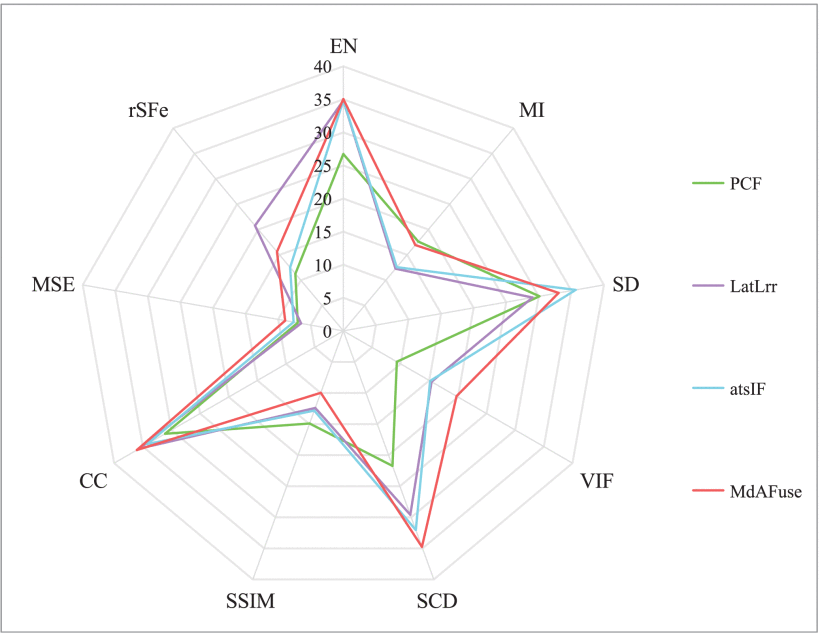
Evaluation metrics of different fusion methods on MR-SPECT image pairs corresponding to dataset No. 010
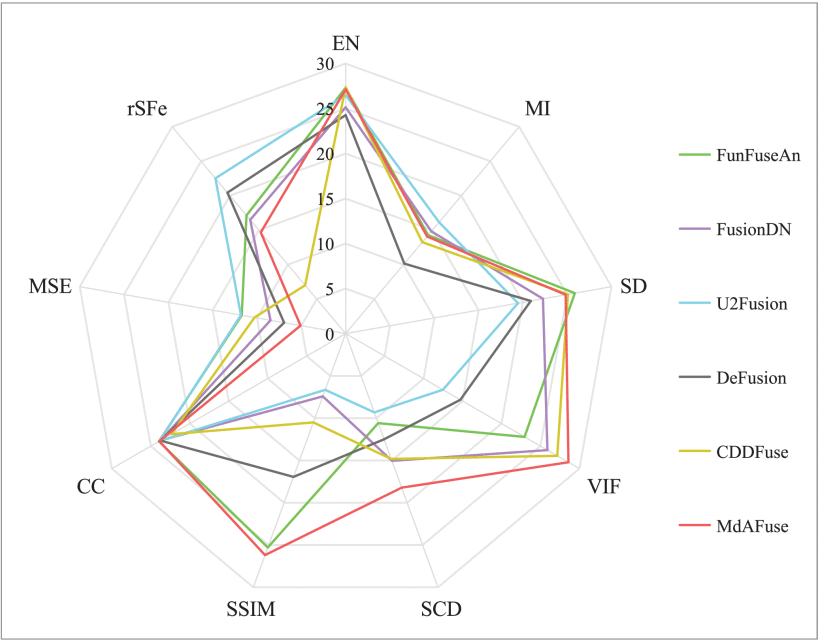
Objective assessment of six kinds of deep-learning-based fusion method corresponding to dataset No. 029.
Claim: MdAFuse is a novel DL-based fusion framework for multi-dimensional features that combines spatial features and channel features. At the same time, a deep separation convolution network is used to excavate richer and useful information, which can provide significant features and rich detail features for source images for subsequent image comprehension and application analysis. Three different feature extraction modules and an adaptive linear fusion mechanism based on the correlation of each dimension feature are used to preserve the spatial texture information of MR images and the physiological metabolism information of PET/SPECT images.
In addition, the model developers also proposed a key feature enhancement method that can enhance the visualization of fusion images in different periods for the same case, which is helpful for clinical applications such as tumor localization, segmentation and disease tracking. Different diseases are evaluated by different commonly used imaging examinations, and multimodal medical image fusion is diverse.
Remarks: Follow-up work shall continue to study different types of medical fusion methods and apply them to AI medical diagnosis. Although MdAFuse framework has demonstrated certain advantages in MR-PET/SPECT image fusion, there are still some limitations. This method only focuses on key features of MR and PET/SPECT images without considering the specificity of a certain disease. In addition, for the fusion of brain images, there was no added neuroscience analysis for areas of potential disease. It will be a meaningful research direction to combine neuroscience and AI methods more deeply in the further research.
