Task: Recurrence Free Survival (RFS) Prediction in Head and Neck Tumors segmented from 18F-FDG PET/CT images
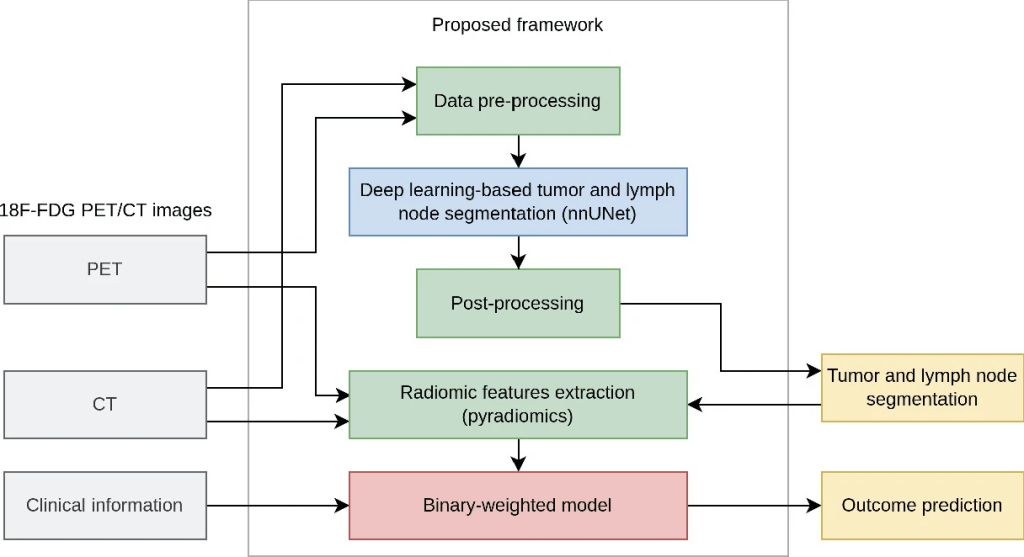
Description: ICARE is a publicly available novel binary-weighted model operating on radiomic features calculated from head and neck (H&N) primary tumor (GTVp) and nodal gross tumor volumes (GTVn) automatically segmented with the publicly available nnUNet deep learning framework. This model was the winning solution for the MICCAI 2022 challenge: HEad and neCK TumOR (HECKTOR) for the outcome prediction task from PET/CT.
ICARE has been combined with nnUNet to create an automated pipeline to segment the primary and metastatic lymph nodes from fluorodeoxyglucose (FDG) positron emission tomography and computed tomography (PET/CT) head and neck (H &N) images and then predict recurrence free survival (RFS) based on the segmentation results.
For segmentation, an out-of-the-box nnUNet-based deep learning method was trained and labelled the two lesion types as primary gross tumor volume (GTVp) and metastatic nodes (GTVn). For RFS prediction, 2421 radiomic features were extracted from the merged GTVp and GTVn using the pyradiomics package. The ability of each feature to predict RFS was measured using the C-index. Only the features with a C-index greater than Cmin, a hyperparameter of the model, were selected and assigned a +1 or –1 weight as a function of how they varied with the recurrence time. The final RFS probability was calculated as the mean across all selected feature z-scores weighted by their +/–1 weight.
Data: To develop and evaluate the proposed pipeline, the HECKTOR 2022 data were employed which included FDG PET/CT images, clinical and survival data of 524 patients from 7 centers for training and PET/CT and clinical data only of 359 patients from 3 centers for blind testing of the models. In the training data, reference segmentations of the primary tumor (GTVp) and metastatic nodes (GTVn) were provided. Train and test PET/CT scans were provided with 9 clinical features with some missing values:
- gender,
- age,
- weight (1.23% missing values),
- tobacco (0=no, 1=yes) (61.1% missing),
- alcohol (0=no, 1=yes) (68.5% missing),
- performance status (56.0% missing),
- human papillomavirus (HPV) status (0=no, 1=yes) (35.2% missing),
- surgery (0=no, 1=yes) (38.7% missing), and
- chemotherapy (0=no, 1=yes).
RFS was provided for 488 patients in the train set, and 339 patients of the test set for whom the outcome was known were concerned by the outcome prediction (task 2).
Outcome Prediction: The outcome (recurrence free survival – RFS) prediction model was based on engineered radiomic features extracted from the tumor regions segmented using the automated approach. These features were then analyzed using an original approach yielding a binary-weighted model.
The segmentation masks were produced by the automated nnUNet deep learning model. The segmented primary tumor and lymph node regions were then merged as a single “lesion” mask. To make the model less sensitive to potential segmentation errors, multiple masks were created from this binary lesion mask:
- Original lesion mask
- Smallest bounding box enclosing all the lesions
- Lesion mask refined by removing all voxels in which SUV was less than 2.5
- Lesion mask refined by removing all voxels in which SUV was less than 4
- Lesion mask re-segmented with a threshold of 40% of global SUVmax
- Lesion mask dilated by 1mm (resp 2, 4, 8 and 16 mm)
- A 2mm (resp 4, 8 mm) thick shell surrounding each connected component of the lesion mask
For each of these 13 masks, 93 radiomic features were computed on the PET image and 93 on the CT image with pyradiomics. These features were the default features from pyradiomics, composed of features reflecting the ROI shape, and the signal intensity and texture. A fixed-bin size of 0.3 SUV units was used for PET images and 10 HU for the CT. Three handcrafted features were added:
- the number of tumor masses,
- the number of lymph nodes, and
- a binary variable indicating whether the scan was a whole-body scan or included only the H &N region. This was determined by calculating the length of the scan in the axial direction from the image volume.
Used together with the provided nine clinical features, this pipeline produced 2430 radiomic features.
Based on literature and the model developers experience, it would be difficult to accurately estimate biomarker importance in outcome prediction. For instance, Adams et al. found the national comprehensive cancer network international prognostic index to be more predictive of progression free survival than whole-body total metabolic tumor volume in diffuse large B-cell lymphoma, while Cottereau et al. observed the opposite. Indeed, noise in the data, censoring of the target, e.g. progression free survival, and relatively low number of training samples might increase the risk of biased estimation of the feature weights. To mitigate this effect, the model developers proposed to reduce the learned information to the bare minimum and only estimate a sign to be assigned to each feature for estimating the target, as described above.
Prediction on test set: For predictions on the test set, three strategies were used. First the five models trained during cross-validation were ensembled. Second, a bagging strategy was adopted to increase the number of ensembled models to nine. The nine models were then trained on random samples of size equal to the whole dataset drawn with replacement (i.e. bootstrap samples). The predictions from the models were then aggregated using majority voting. Nine was the maximum number of models that could be trained on the developers GPUs for this strategy within the allotted time of the challenge. Finally, the number of epochs were increased to 1500 and only one model was trained on the whole dataset.
The ICARE GitHub package contains the Individual Coefficient Approximation for Risk Estimation survival model. For ensembling strategies, it also includes a dedicated bagging aggregator.
Curse of Dimensionality: The curse of dimensionality is a phenomenon where we observe a loss in performance of ML models when too many features are given as an input. This especially occurs in medical datasets when the data are high-dimensional and the number of samples is low. The model developers hypothesized that the binary-weighted model is resilient to this phenomenon. This hypothesis was tested on the train set of the HECKTOR dataset by gradually increasing the number of features input to the model (see results section).
Ensembling: To produce a more precise and stable estimate y, a bagging strategy was adopted (note in preceding section: prediction on test set). An ensemble of E binary-weighted models were trained, each model being trained on a random sample of size N of the training data drawn with replacement. Each model also randomly selected F features to work with. The models were trained on their bootstrap sample from the train set and predicted y on the test set. The E predictions from the E models were then aggregated with the median. F is a hyperparameter of the ensemble model. Our experiments on the train set suggested that the higher E, the better the performance. We used E=105 on the test set, a number large enough to ensure good results while keeping computational cost reasonable.
The fully automated pipeline was developed by the LITO research group led by Prof Irene Buvat of Institut Curie a leading cancer research and treatment center in France.
Results: The model was applied to the data provided through the HECKTOR 2022 MICCAI challenge. On the test data, the fully automated segmentation model achieved 0.777 and 0.763 Dice scores on the primary tumor and lymph nodes respectively (0.770 on average). The binary-weighted radiomic model yielded a 0.682 C-index. These results allowed the pipeline to be ranked first for outcome prediction and fourth for segmentation in the challenge.
The below Table shows the results of the different models tested during the challenge. A binary-weighted model without bagging was evaluated only on the train set and not submitted because its performances were below the bagged models on the train set. The performance of the three submitted bagged models is correlated with the number of hyperparameter sets evaluated on the train set. The best model was the one which had the most extensive search of hyperparameters.
| Model | CV C-index train set (CI) | C-index test set | Nb tested sets of hyperparameters |
|---|---|---|---|
| Binary-weighted | 0.645 (0.585 – 0.707) | 10 | |
| Binary-weighted bagged | 0.668 (0.605 – 0.730) | 0.670 | 10 |
| Binary-weighted bagged | 0.675 (0.613 – 0.731) | 0.673 | 100 |
| Binary-weighted bagged | 0.688 (0.642 – 0.732) | 0.682 | 1000 |
The below figure illustrates the result of the experiment using the train set to test the model developers hypothesis stating that binary-weighted models do not suffer from the curse of dimensionality. The performance plateaued when increasing the number of features used by the model up to the maximum number of available features.

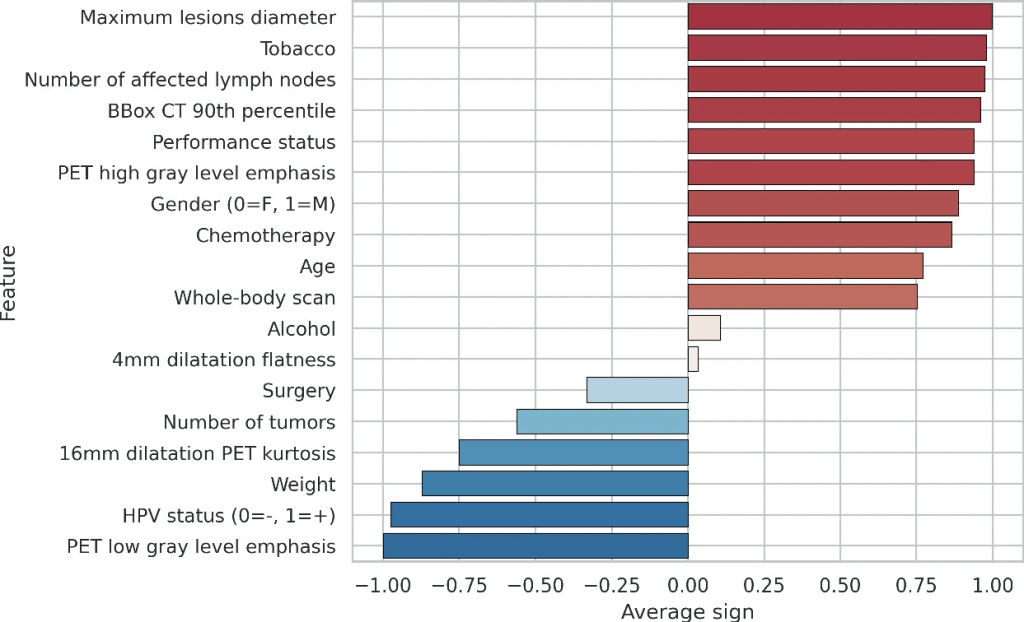
The importance of the clinical and some representative radiomic features evaluated on the train set is presented in the following figure. The error bars are not shown by the model developers because by construction of the model, they are unnecessary (the higher the absolute value, the lower the standard deviation).
Claim: The proposed fully-automated pipeline from segmentation to outcome prediction using a binary-weighted radiomic model competes well with more complicated models.
