Task: A novel residual neural network (“ArcheD”) to predict amyloid-beta cerebrospinal fluid (CSF) concentration directly from amyloid-beta (Αβ) PET scans, independent of the tracer, brain reference region or preselected regions of interest.
Public Availability: ArcheD code is available at GitHub. Data used for training and evaluation the model were obtained from the Alzheimer’s Disease Neuroimaging Initiative (ADNI) database.
Description: A convolutional neural network model (“ArcheD”) with residual connections to predict Aβ CSF concentration from amyloid PET images. Residual deep networks have been used in PET image analyses previously (Ext. Ref.), yet in this apporach developers assessed their applicability in predicting fluid biomarker levels from PET images. Their approach allows probing the model and input amyloid PET images to reveal the brain regions that contribute most to the predicted CSF amyloid concentrations. ArcheD does not use any prespecified cortical (or other) brain regions, but instead adopts a hypothesis-free approach leveraging all information available in PET images.
The deep convolutional neural network model utilizes residual connections (Ext. Ref.) to predict logarithmic Aβ CSF values from amyloid PET scans. The residual connections allow for a deeper model to be trained, which has been shown to improve performance (Ext. Ref.). The ArcheD model architecture includes one initial convolution-pooling block followed by two residual-pooling blocks, two fully connected layers and a linear regression node. Each residual block contains a sequence of convolutional, batch normalization and rectified linear activation function (ReLU) activation layers.
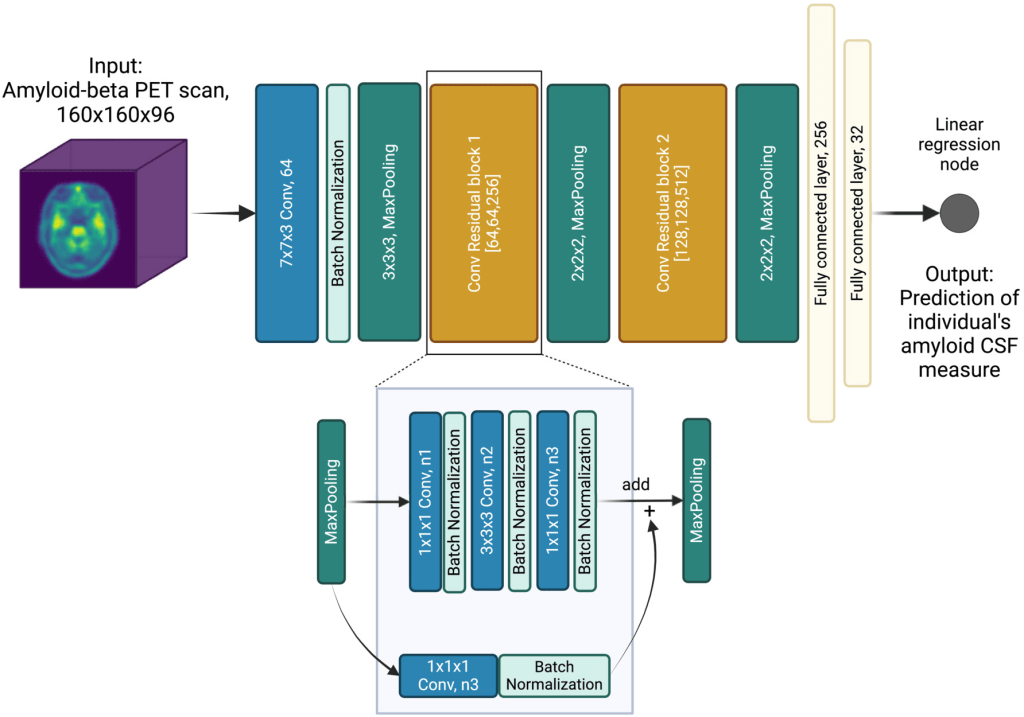
Schematic presentation of the ArcheD model architecture. PET – positron emission tomography; CSF – cerebrospinal fluid; n1, n2 and n3 – the number of filters in convolution layers are specified in brackets for both convolutional residual blocks
ArcheD contains 35 layers and approximately 10.7 millions parameters. To train the model, the Adam optimization algorithm (Kingma & Ba, 2014) was used with an initial learning rate of 0.0001 to minimize the mean squared error (MSE) of observed and predicted CSF values. The model was trained for a maximum of 150 epochs with a minibatch size of four, and stopped early if loss in the validation dataset did not decrease for 15 epochs.
The developers used 60% of the dataset for training (n = 1197), 20% for validation (n = 299) and 20% for testing the model (n = 374). To increase the size of the training dataset with data augmentation, they either applied Gaussian noise (σ = 0,5,10,15,20,25%; six possible augmentations) or flipped the image by X or Y axes (two possible augmentations). To generate an augmented image from a training dataset image, one of the eight possible augmentations was selected with an equal probability. In the end, a total of 14,352 original and augmented brain scans were obtained constituting the augmented training data. To evaluate the robustness of ArcheD in data not used in training, a test dataset was used.
Evaluation: To examine their approach, the developers compared their method’s performance with SUVR, a measure that determines cortical amyloid aggregation in relation to the cerebellum, a commonly used reference region (Ext. Ref.; Ext. Ref.). The model was also studied in relation to episodic memory including immediate and delayed recall measures. The developers further investigated the model and brain regions separately in sub-groups based on both clinical and biological classification of AD. To scrutinize the trained neural network model, they extracted brain regions that the model considers informative for CSF prediction and compared them between clinical and biological classes.
Dataset: PET and MRI scans, CSF measurements, ADNI clinical classifications, episodic memory measurements and demographics data were used from the ADNI database. Amyloid PET scans were obtained with different tracers (i.e., Pittsburgh compound B, Florbetapir, Florbetaben) depending on the ADNI study phase, and pre-processed by the ADNI PET imaging corelab (i.e., ‘co-reg, avg, standardized image and voxel size’). In addition to imaging data, the developers used the cortical composite standardized uptake value ratios (SUVR) (Ext. Ref., Ext. Ref.) normalized by the whole cerebellum as a reference region, and added it as a standard amyloid measurement from PET in their model’s performance evaluation.
As some participants had several clinical visits, a total of 1870 amyloid PET images were obtained. Among them individuals had AD (n = 190), amnestic mild cognitive impairment (aMCI) due to AD (n = 928), subjective memory complaints (SMC) (n = 145) or were cognitively normal (CN) (n = 607) based on the ADNI clinical classification. The clinical classifications in ADNI are based on the Clinical Dementia Rating (CDR), the Mini-Mental State Examination (MMSE) and delayed recall of 1 paragraph from the Logical Memory (LM) II of the Wechsler Memory Scale-Revised (Ext. Ref.). In addition to clinical classifications, the developers used immediate and delayed recall measures from the LM Story A and also immediate (total words in trials 1–5) and delayed recall measures of the Rey Auditory Verbal Learning Test (AVLT): these tests were used as continuous measures of episodic memory.
Explainability: To explore which brain regions contribute the most to ArcheD’s predictions of amyloid CSF measurements from amyloid PET scans, the guided backpropagation technique was used (Ext. Ref.). This approach quantifies how much model outputs change in response to perturbing model inputs serving as a method to explain the model predictions. In PET imaging data, guided backpropagation can be used to extract the contribution (relevance value or attribution) of each input voxel to CSF prediction. Guided backpropagation creates more specific relevance value (attribution) maps compared to the classic backpropagation approach by replacing negative gradients with zero in ReLU activation layers during backward passes (Ext. Ref.).
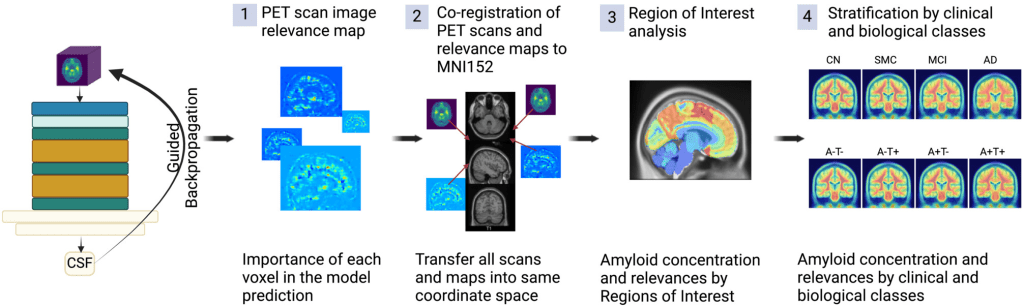
Workflow to process PET scans with ArcheD and guided backpropagation to identify characteristics distinguishing brain regions and clinical and biological groups
Results: The developers first transformed AlzBio3 CSF values to conform to the range of values present in Roche Elecsys CSF measurements (Ext. Ref.). Both regression models performed similarly on a held-out portion of the data (linear regression: R2test = 68.9%, 91.5% accuracy; third-degree polynomial regression: R2test = 69.4%, 91.5% accuracy). Based on these metrics and visual inspection of the regression models (left Figure below), the developers decided to use a third-degree polynomial regression model to predict Roche Elecsys amyloid measurements for the remaining 1102 samples. ArcheD was trained on 14,352 augmented PET scan images to predict logarithmic CSF values. The model achieving the best performance in the validation set was obtained after the eighth epoch of training (mean squared error, MSE = 0.12). ArcheD explained 66% of the variance (R2) in the test dataset not used in training (right Figure below):
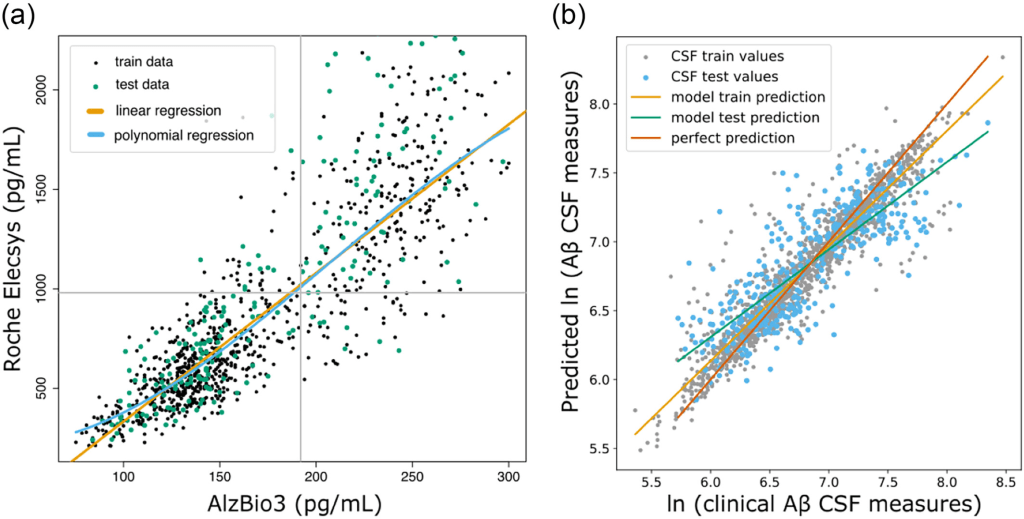
(a) Linear (orange line) and third-degree polynomial (blue line) regression for fluid amyloid rescaling from INNO-BIA AlzBio3 system to Roche Elecsys. Grey lines present cut-off values for Aβ CSF measurement. (b) Comparison of clinically measured Aβ CSF and values predicted by the ArcheD model. CSF values are given as natural logarithms. Lines illustrate the linear relationship between clinical Aβ CSF measurement and prediction of our model: green – linear relation between real and predicted values of the test dataset; orange – linear relation between real and predicted values of the training dataset. The red diagonal line shows the ideal one-to-one correspondence between observed and predicted values.
ArcheD-predicted Aβ CSF values correlated with measured Aβ CSF values (r = 0.92; q < 0.01), SUVR (rAV45 = −0.64, rFBB = −0.69; q < 0.01) and episodic memory measures (0.33 < r < 0.44; q < 0.01).
To understand which brain regions contributed the most to ArcheD predictions, the developers compared the relevance of these regions with guided backpropagation. They found that the areas that contributed the most were cerebral (mean relevance 0.251, 95% CI [0.247, 0.255]) and cerebellum white matter (0.207, 95% CI [0.205;0.208]) followed by the brain stem, subcortical areas, grey matter regions at the lobar level and cerebellum grey matter, whereas limbic lobe, basal forebrain, ventricles and optic chiasm were substantially less important for the model
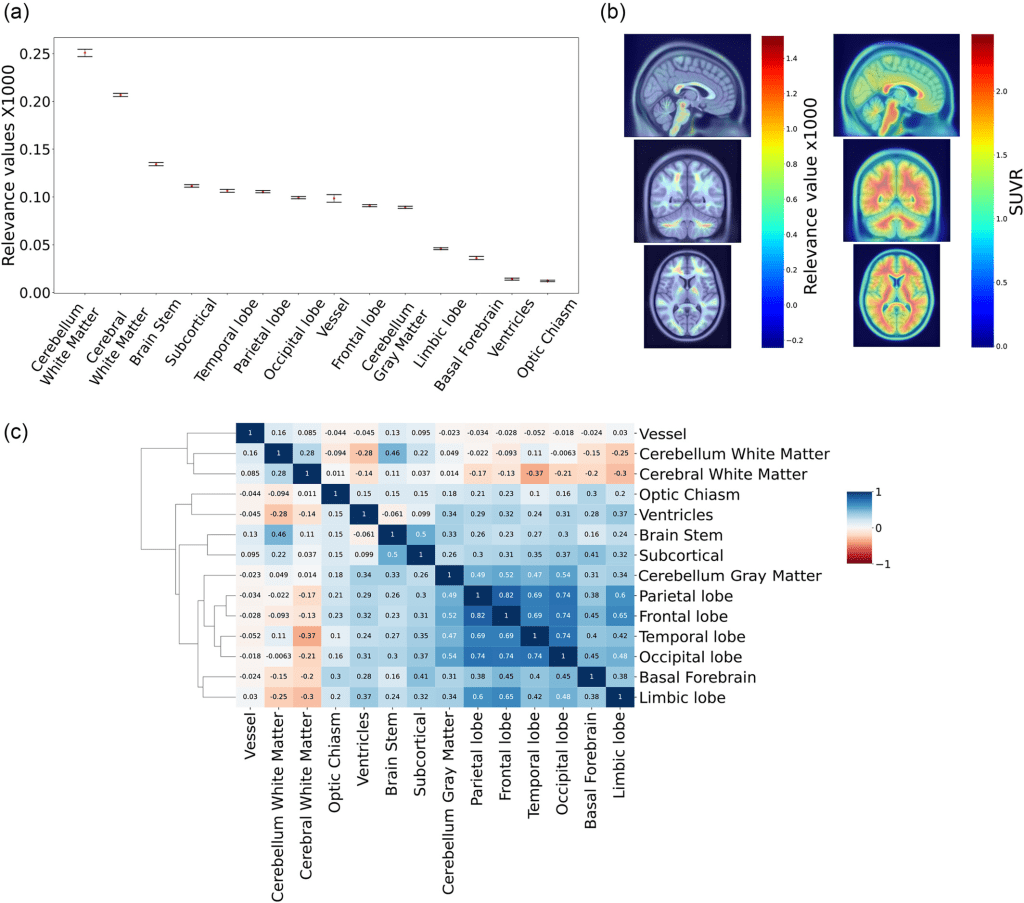
(a) Mean relevance values for brain regions and bootstrapped 95% confidence intervals. Values were multiplied by 1000. (b) Average relevance value and amyloid concentration (SUVR) for the dataset on PET scan. (c) Heatmap of Pearson correlations for relevance values of all brain regions.
For both classifications, cerebral white matter significantly contributed to CSF prediction (q < 0.01), specifically in non-symptomatic and early stages of AD. However, in late-stage disease, the brain stem, subcortical areas, cortical lobes, limbic lobe and basal forebrain made more significant contributions (q < 0.01). Considering cortical grey matter separately, the parietal lobe was the strongest predictor of CSF amyloid levels in those with prodromal or early AD, while the temporal lobe played a more crucial role for those with AD.
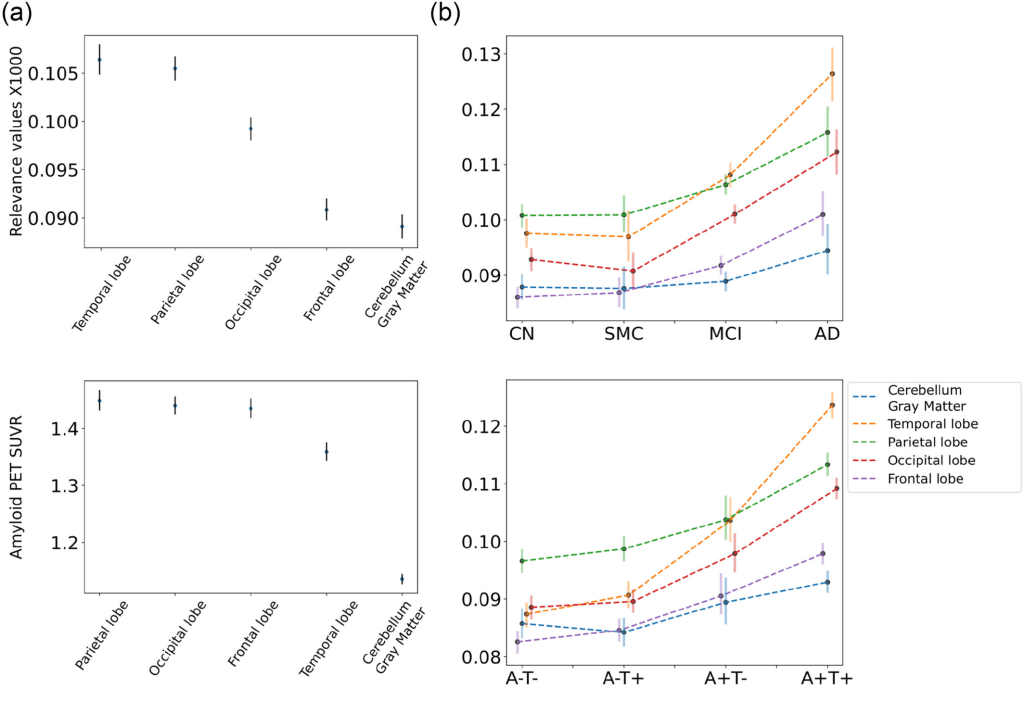
(a) Mean relevance values (top) and amyloid concentration (bottom) for grey matter regions and bootstrapped 95% confidence intervals. (b) Relevance level of grey matter regions on different clinical (top) and biological classes (bottom) of AD.
Claim: ArcheD was able to predict amyloid CSF values directly from amyloid PET scans in the AD continuum (including cognitively unimpaired individuals with preclinical AD). Predicted CSF values correlated significantly with CSF amyloid, cortical amyloid SUVR and episodic memory performance. Analysing the relevance of brain regions to model’s CSF prediction, cerebellar and cerebral white matter, brainstem and subcortical areas were found to contribute the most and may have been used by ArcheD as reference regions for prediction. Upon comparing clinical and biological classes we found that the subcortical areas, brain stem, cerebellum, cerebral cortex and its subregion – the basal forebrain, influenced predictions, especially in the MCI and AD clinical sub-classes and A + T- and A + T + biomarker-defined classes. Moreover, cerebral white matter contributed more to clinically normal and biologically defined early-stage groups. Examining cortical regions more closely, the developers observed a constant higher level of the temporal lobe relevance along the entire AD continuum and assumed that the model prioritized it as a predictor of Aβ CSF. ArcheD model can serve in clinical practice for determining an Aβ CSF state and improving AD early detection. However, further studies are needed to validate and tune the model for clinical use.
Remarks: ArcheD deep neural network can be utilized for the prediction of CSF amyloid biomarker concentration directly from amyloid PET images independent of the amyloid PET tracer. Trained on ADNI PET images and associated Aβ CSF measurements, ArcheD was able to explain 66% of the variance in CSF levels in a test dataset withheld from training. The developers thus envision using ArcheD to complement the information obtained in an Aβ PET scan by providing an estimate of the Aβ CSF level without a lumbar puncture. The model learned to focus on specific brain regions depending on the AD stage, defined by the biological or clinical classification. These regions aligned well with previous findings on AD progression.
ArcheD has the potential to be used in clinical practice in the future. It can reduce the amount of work for clinicians and potentially prevent patients from lumbar puncture. ArcheD is also straightforward to use, as the PET scan image is the only input to the method. However, the associated research has some limitations that can be improved in future studies. Only a limited dataset of PET scans with available CSF measurements has been included, especially of AD individuals, to train the ArcheD model. Larger training datasets would likely yield better predictive performance. Another limiting factor is the strict requirement for input PET images to have dimensions of 160x160x96 voxels. Therefore, users may need to perform preprocessing, such as co-registration, averaging, standardization and voxel size adjustment, similar to ADNI PET imaging corelab, on their own. The model and the associated evaluation findings need also to be validated on external datasets.
Programming Environment: Tensorflow 2.4.1 and Python 3.9.7 were used to develop the machine-learning models and perform computational analyses. The models were trained on NVIDIA Tesla V100 GPUs with 16 GB memory. For uploading, augmentation, registration and visualization of PET images we used nibabel, dltk and AntsPy python packages (Ext. Ref., Ext. Ref., Ext. Ref.). Functions for guided backpropagation gradient analysis were adapted from GitHub Repository 1. All R and Python scripts used in the study are provided at GitHub Repository 2.
