Task: To impute tau-PET images from more widely available cross-modality imaging inputs
Description: The AI-imputed tau-PET model is a 3D Dense-U-Net Convolutional Neural Network (CNN) that imputes synthetic tau-PET images from more widely available cross-modality imaging inputs (18F-FDG PET, amyloid PiB-PET, or T1-weighted MR images). It is hypothesized that the proposed CNN model trained on a large neuroimaging sample might enable an accurate imputation of spatial distribution of tau pathology by learning the underlying biological relationship between biomarkers. This might be useful for a medical decision-making as the approach can provide a clinically useful mapping from one modality to another.
In the model’s reference study, the developers first introduced the 3D Dense-U-Net model for the imputation of tau-PET from either FDG-PET, amyloid-PET or structural T1w and then compare the performance of each modality-based tau-PET imputation models. Moreover, the clinical implications of the artificial intelligence (AI)-imputed tau-PET are evaluated by assessing the model’s predictive ability for classifying tau positivity and clinical diagnostic groups.
Participants from the Mayo Clinic Study of Aging (MCSA) or the Alzheimer’s Disease Research Center study (ADRC) who underwent T1w, FDG-PET, amyloid-PET with 11C-PiB (Pittsburgh compound B) and tau-PET with 18F-Flortaucipir (AV-1451) were included (n = 1,192, number of scans = 1505). To examine whether the trained model presents a dataset-specific bias, the Alzheimer’s Disease Neuroimaging initiative (ADNI) dataset was utilized. For the ADNI cohort, all visits were pulled corresponding to a 3T accelerated T1w, FDG-PET and tau-PET where available (n = 288). Amyloid-PET from the ADNI database was not used for the external evaluation because different amyloid tracers (Florbetapir and Florbetaben) were used in that study. The ADNI dataset included normal controls (n = 15), Mild Cognitive Impairment (MCI) patients (n = 205) and dementia patients (n = 68). Image IDs for the ADNI cohort used in this study can be downloaded from here.
The 3D Dense-U-Net architecture of the AI-imputed tau-PET model is based on another 3D Dense-U-Net model originally introduced by Kolarik et al. for the automated high-resolution 3D volumetric segmentation of medical image data using a supervised deep learning approach. The densely interconnected multi-layered U-shaped convolutional neural network architecture of AI-imputed tau-PET model is illustrated in the figure below:
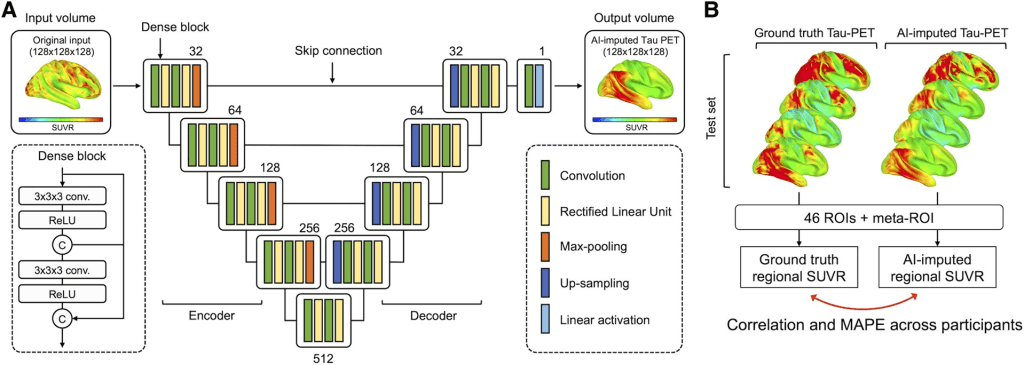
The network is a U-Net type architecture with dense interconnections between convolutional layers (dense block). The architecture is comprised of four downsampling (encoder) blocks for feature extraction and four upsampling (decoder) blocks for image reconstruction, which are connected by a bridge block. Within every block, the convolutional layers are densely interconnected in a feed-forward manner. The network doubles or halves the number of filters (denoted above each block) along each successive encoder and decoder path, respectively. The architecture takes input volumes of size 128 × 128 × 128 and outputs the images with the same dimensions. For this, we resized the volume by cropping and zero padding so that it is divisible by two until the bottom of the network for the max-pooling and upsampling procedure. Along the anterior-posterior axis, eight slices of anterior and nine slices of posterior were cropped. Then, seven slices were padded on the left and bottom of the cropped volume, forming a 3D data of size 128 × 128 × 128. The output volume of the network was reconstructed as the original size (121 × 145 × 121) for the visualization.
The neural network was implemented using Keras with TensorFlow as the backend. Cross-validation experiments were conducted using 5-fold validations (60% training set, 20% validation set and 20% test set). To prevent any possible data leakage between the training and validation/testing datasets, any overlap of participants among training, validation and test sets was excluded. Within each set, multiple scans per subject were included. Demographics for participants in the training, validation and testing datasets for each fold can be found in the model’s reference publication Supplementary Tables 2 and 3, including pertinent clinical variables, measures of cognitive performance and tau-PET meta-ROI SUVR, which can be considered as a ground-truth measure of model training.
The composition among the training, validation and test groups was relatively similar. The model was optimized using Adam optimizer with parameters: β1 = 0:9 and β2 = 0.999. The training epoch used was 150. The learning rate from training was set to 1 × 10⁻⁴ and decreased by a factor of two for every 10 epochs. If the validation error did not improve in seven epochs, the learning rate was updated. A mini batch of size 2 was used. The mean squared error was used as the loss function.
Results: Participants (n = 1192) with brain T1-weighted MRI (T1w), fluorodeoxyglucose (FDG)-PET, amyloid-PET and tau-PET were included. All evaluated CNN models could impute tau-PET images with high accuracy, with the FDG-based model attaining the highest accuracy, followed by amyloid-PET and T1w. In testing implications of artificial intelligence-imputed tau-PET, only the FDG-based model showed a significant improvement of performance in classifying tau positivity and diagnostic groups compared to the original input data, suggesting that application of the model could enhance the utility of the metabolic images. The interpretability experiment revealed that the FDG- and T1w-based models utilized the non-local input from physically remote regions of interest to estimate the tau-PET, but this was not the case for the Pittsburgh compound B-based model.
Initially, tau-PET images were imputed using glucose metabolism images obtained by FDG-PET. The figure below shows eight representative example cases from the test set, comparing the original FDG-PET, ground-truth tau-PET and AI-imputed tau-PET. As illustrated in sub-plot A, the AI-imputed tau-PET image showed good agreement with ground-truth images in visual assessment. A high degree of similarity was observed for cases with high tau burden (Cases 6, 7 and 8) and cases with subtle tau tracer activity (Cases 1 and 2), demonstrating the range of tau activity the model is capable of characterizing.
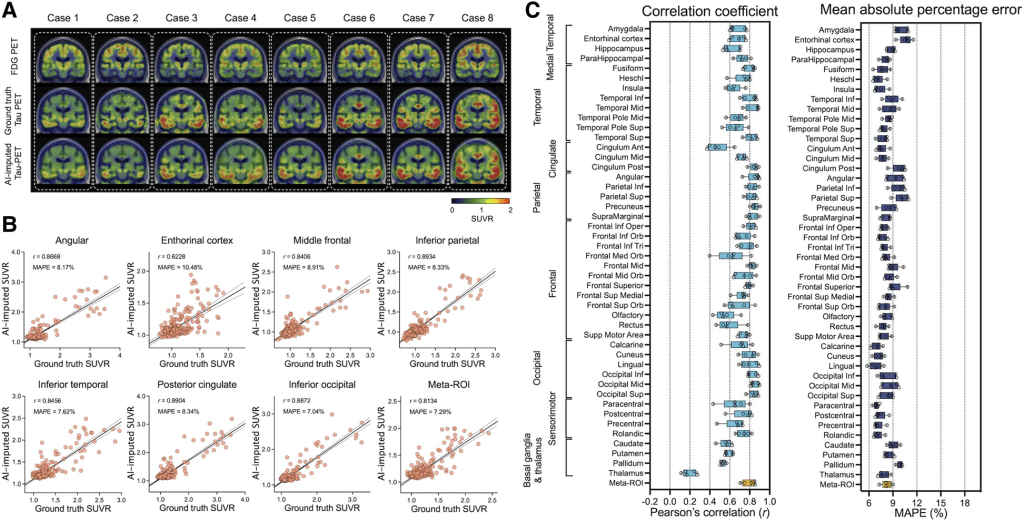
To quantify the model’s performance, regional SUVRs and meta-ROI SUVRs extracted from both the ground-truth and AI-imputed tau-PET scans were compared (figure section A). The AI-imputed tau-PET SUVR, when plotted against ground-truth tau-PET using a real tau tracer, demonstrated that each regional SUVR showed a high correlation (r > 0.8) and low MAPE (∼8%), which is moderately higher than the test-retest variability of AV-1451 PET, as well as the meta-ROI (figure section B). The mean correlation coefficient and MAPE of 5-fold summarized for each anatomic ROI and the meta-ROI reflect the performance of the model (figure section B). The mean correlation coefficient for the meta-ROI was 0.79 ± 0.06 and the MAPE was 8.24 ± 0.64%. The regional SUVR of the basal ganglia and thalamus, a known region of off-target AV-1451 binding, showed relatively lower performance.
Next, the same Dense-U-Net architecture was employed to impute tau-PET using structural T1w. The model was initialized and separately trained from scratch. The prediction accuracy of T1w model was significantly lower than the FDG-based model [F(1376) = 424.1, P < 0.001 for correlation coefficient and F(1376) = 159.5, P < 0.001 for MAPE, using a two-way ANOVA.
In addition, the same model was trained using amyloid-PET inputs from the PiB radiotracer. The PiB-based model was also able to generate AI-imputed tau-PET scans with high accuracy and the mean correlation between ground-truth regional SUVR and AI-imputed regional SUVR was found to be 0.41–0.76 and the MAPE range was ∼7–11% . The general performance was significantly lower than the FDG-based model [F(1376) = 96.76, P < 0.001 for correlation coefficient and F(1376) = 30.77, P < 0.001 for MAPE, using a two-way ANOVA]; however, the performance was significantly higher than the T1w-based model [F(1376) = 137.7, P < 0.001 for correlation coefficient and F(1376) = 80.63, P < 0.001 for MAPE, using a two-way ANOVA].
Although the AI models, particularly the FDG- and PiB-based imputations, showed high accuracy in predicting the spatial distribution of tau pathology from input data, the clinical utility of AI-imputed tau images might be questionable due to the variability of predicted values. Therefore, in the AI-imputed tau-PET model’s reference study additional experiments were performed to assess the clinical implications of the AI-imputed tau-PET images. In particular, ROC analyses was conducted for predicting tau positivity.
For FDG-PET, the study reported in the figure below that applying the model was more successful in predicting tau positivity than the actual FDG SUVR (figure sections A–C). The FDG-imputed tau-PET showed significantly improved AUROC values versus the actual FDG, except at the lowest SUVR threshold (1.11) (P = 0.004 for 1.21, P < 0.001 for 1.33 and 1.46, Holm-Sidak test, section C).
A similar ROC analysis was performed using cortical thickness directly measured from T1w examinations and T1w-based AI-imputed tau-PET scans to predict true tau-positive participants (figure sections D–F). In contrast to the FDG-based model, the T1w-based imputation was not more successful than direct measurement of cortical thickness (figure sections D–F). No significant differences were found in the AUROC (P > 0.05 for SUVR thresholds 1.11, 1.21, 1.33 and 1.46, Holm-Sidak test).
The PiB-based model showed no significant improvement in the AUROC for tau prediction compared to actual PiB-PET SUVR (figure sections G–I). According to the model’s reference study, this result implies that imputing tau-PET scans from the FDG could augment clinical utility beyond using the FDG-PET alone. Meanwhile, the T1w and PiB model did not add predictive value for classifying tau positivity compared to the cortical thickness or PiB-PET SUVR.

Claim: The reported results imply that the proposed AI-imputed tau-PET model can learn the distinct biological relationship between FDG-PET, T1w and tau-PET from the relationship between amyloid-PET and tau-PET.
The FDG-based model of AI-imputed tau-PET demonstrated a high degree of correlation to ground-truth tau-PET for patients on the MCI-AD spectrum, distinguished tau-positive versus tau-negative patients, and classified diagnostic groups with performance similar to the AV-1451 tau-PET exams. AI-imputed tau is feasible and has a potential to augment the value of FDG-PET for MCI and Alzheimer’s disease patients. Although the bimodal training did not yield significant improvement, more thorough optimization of the model’s architecture to maximize the efficiency of multimodal inputs could potentially enhance the performance.
Data Availability Statement: In accordance with current standards for protection of sensitive patient information in the MCSA and ADRC that undergo continuous review by study leadership, the current data access policy indicates that qualified academic and industry researchers can request data, biospecimens or both. Qualified researchers interested in these data sharing opportunities can submit a request to the centre’s executive committee. Once a request is submitted, the committee confirms request receipt and provides a review timeline.
Additional data are available from:
- the Mayo ADRC for images that meet Standardized Centralized Alzheimer’s and Related Dementias Neuroimaging (SCAN) imaging criteria
- the National Alzheimer’s Coordinating Center
- Alzheimer’s disease Neuroimaging Initiative (ADNI) database upon registration and compliance with the data usage agreement.
AI-imputed tau-PET model GitHub Page
AI-imputed tau-PET Model’s Reference Publication
Important Note: The basic 3D Dense-U-Net CNN model architecture of the AI-imputed tau-PET model was based on the following AI model used initially for brain segmentation tasks.
