Task: Detection of Focal Cortical Dysplasia (FCD) lesions by combining quantitative multimodal surface-based features with machine learning and to assess its clinical value.
Decription: The FCDdetection model is a neural network classifier using surface-based features to identify focal abnormalities of cortical development. Two major reference publications have employed the FCDdetection classifier for two separate neuroimaging applications.
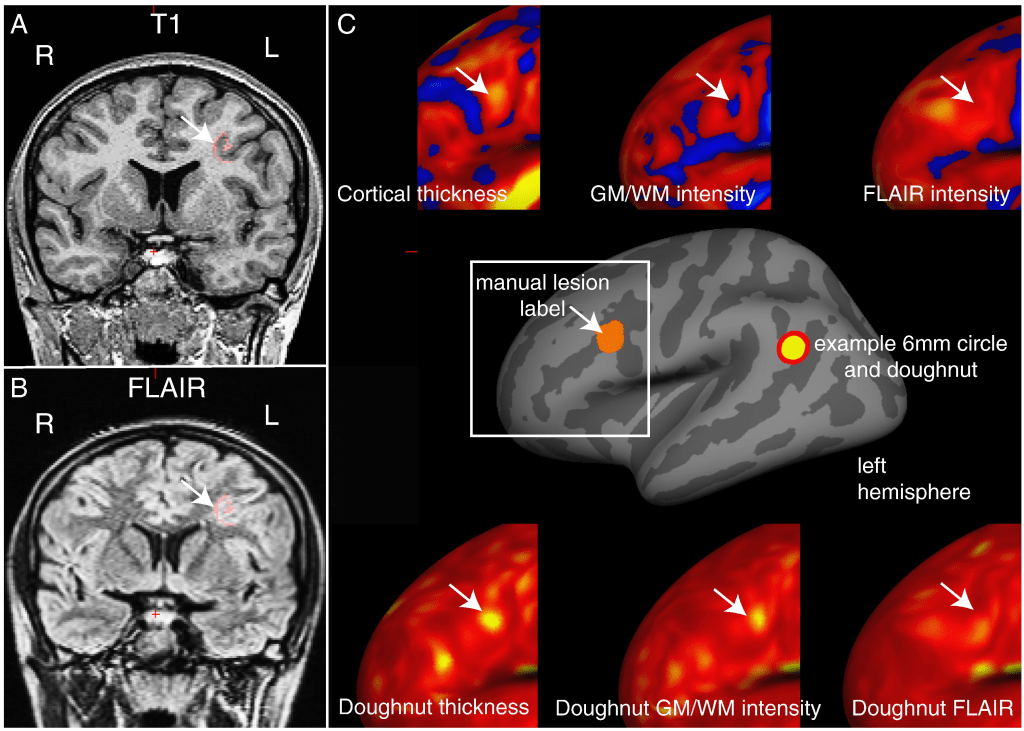
In the first reference study by Adler et al, the FCDdetection model was utilized to automatically detect FCD lesions in pediatric epilepsy from multiple MR image modalities. In addition to established measures, such as cortical thickness, grey-white matter blurring, FLAIR signal intensity, sulcal depth and curvature, our novel features included complementary metrics of surface morphology such as local cortical deformation as well as post-processing methods such as the “doughnut” method – which quantifies local variability in cortical morphometry/MRI signal intensity, and per-vertex interhemispheric asymmetry.
A 6 mm radius circle was centred on a vertex on the inflated surface (see figure below). A surrounding “doughnut” of cortex of the same area (~ 113 mm2) was placed around it. The cortical thickness, grey-white matter intensity contrast or FLAIR signal intensity was measured within the circle and within the doughnut.
A neural network classifier was trained using data from 22 patients with focal epilepsy (mean age = 12.1 ± 3.9, 9 females), after intra- and inter-subject normalisation using a population of 28 healthy controls (mean age = 14.6 ± 3.1, 11 females). Leave-one-out cross-validation was used to quantify classifier sensitivity using established features and the combination of established and novel features.
In the second reference study by Mo et al, the FCDdetection model is combined with several quantitative multimodal surface-based features for the automated detection of FCD lesions both from multiple MR and PET image modalities. Neuroimaging data and clinical information for 74 participants (40 with histologically proven FCD type II) was retrospectively included. The morphology, intensity and function-based features characterizing FCD lesions were calculated vertex-wise on each cortical surface and fed to an artificial neural network. More specifically, the investigators of this study included eligible structural and functional images [T1-magnetization prepared rapid gradient echo (T1-MPRAGE) sequence, T2-FLAIR sequence and PET], performed image pre-processing [space standardization, cortical construction, co-registration and drawing the region of interest (ROI)] and extracted several surface features (morphological and metabolic characteristics). Then, they initialized the FCDdetection machine learning with the appropriate definitions of its related parameters, trained the resulting neural network classifier model with the corresponding labeled multimodal surface-based feature inputs and performed predictions on new dataset. Lastly, the clinical value and performance of that combined approach was evaluated both quantitatively and qualitatively by performing statistical analysis and conventional visual analysis. The flow diagram of the research study is presented in the figure below:
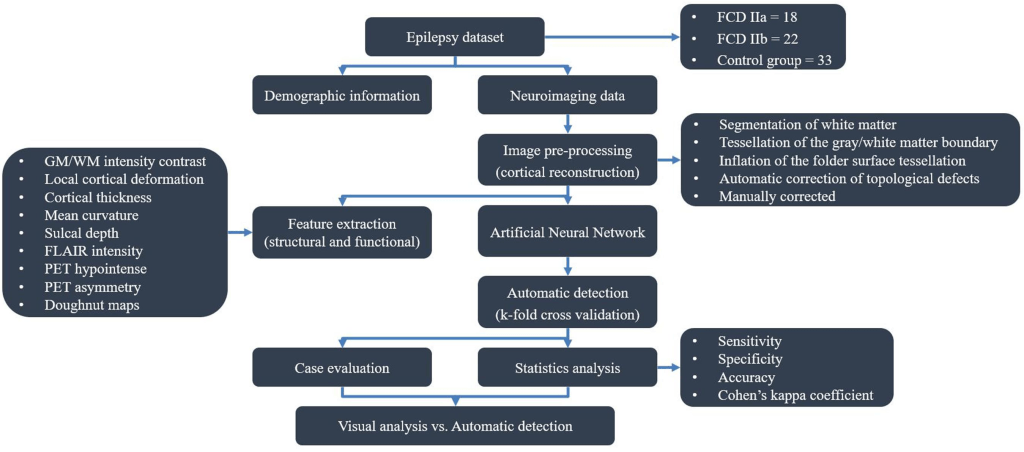
The flow diagram outlining the study design and results is shown in the figure below:

Results: In the first reference study, focal cortical dysplasias in the employed paediatric cohort were correctly identified with a higher sensitivity (73%) when novel features, based on our approach for detecting local cortical changes, were included, when compared to the sensitivity using only established features (59%). These methods may be applicable to aiding identification of subtle lesions in medication-resistant paediatric epilepsy as well as to the structural analysis of both healthy and abnormal cortical development.
Qualitative analysis of the “doughnut” maps indicated that they may provide useful surface features for the detection of FCDs. By quantifying local changes in cortical thickness, grey-white matter intensity and FLAIR intensity (see section C of 1st figure above) this method highlighted locally abnormal areas of cortex. However, these metrics were judged to be sensitive but relatively unspecific.
In the second reference study, the accuracy, sensitivity, specificity of the neural network classifier based on multimodal surface-based features were 70.5%, 70.0%, and 69.9%, respectively, which outperformed the unimodal classifier. There was no significant difference in the detection rate of FCD subtypes (Pearson’s Chi-Square = 0.001, p = 0.970). Cohen’s kappa score between automated detection outcomes and post-surgical resection region was 0.385 (considered as fair).
The statistical analysis of automated detection outcomes is available in the below figure.
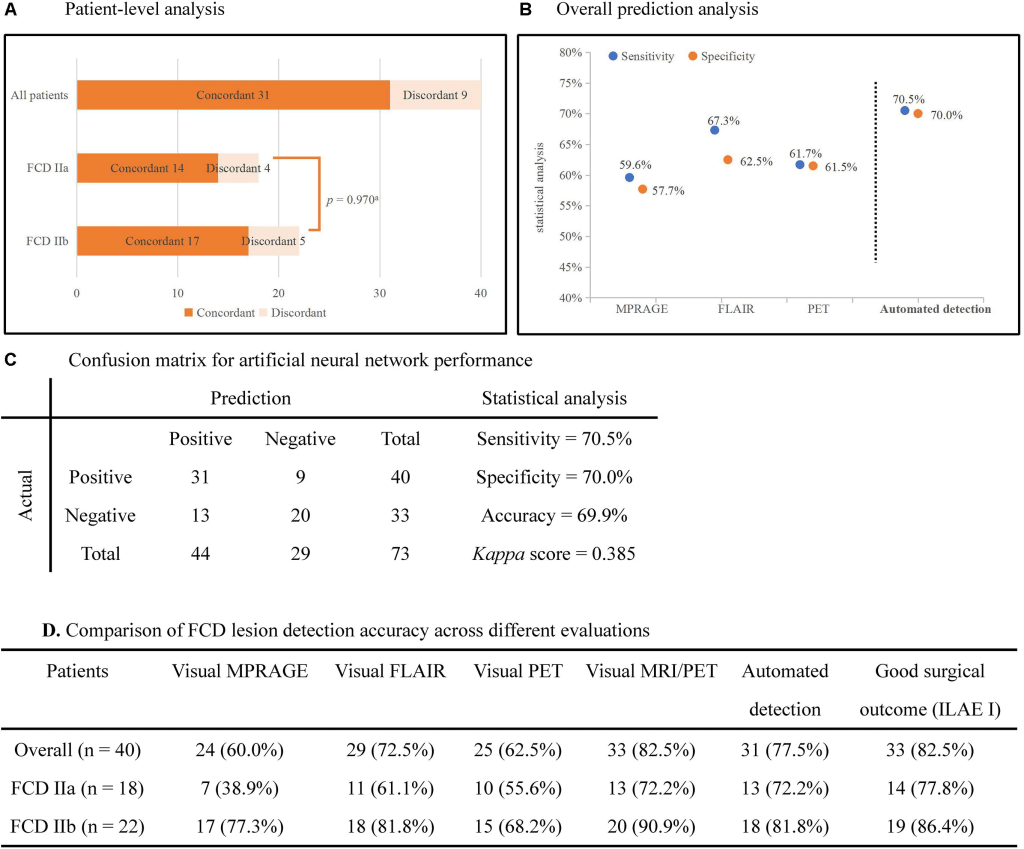
According to the final output, the detected clusters colocalized with the post-surgical resection region in 31 patients, yielding a TP of 77.5% (31/40), and 13 lesional clusters were identified in the control group, resulting in 60.6% (20/33) TN. Therefore, according to the aforementioned formulas, the sensitivity was calculated as 70.5%, specificity as 70.0% and accuracy as 69.9%. There was no significant difference in the detection rate of FCD subtypes (Pearson’s Chi-Square = 0.001, p = 0.970). The outcomes of separate neural networks operating on unimodal (lesional features derived from only one modality, such as T1-MPRAGE, T2-FLAIR or PET) were lower than the performance on multimodal classifiers, and the statistical analysis is shown in sections B and D of the above figure. Cohen’s kappa score between the automated detection outcomes and post-surgical resection region was 0.385 (considered as fair).
Claims: In the first reference study, the proposed neural network automated classifier utilizing the FCDdetection model with MRI-based surface feattures may be applicable to aiding identification of subtle lesions in medication-resistant paediatric epilepsy as well as to the structural analysis of both healthy and abnormal cortical development.
In the second reference study, the combination of the automated FCDdetection neural network classifier with multimodal surface features can provide objective and intelligent detection of FCD lesions in pre-surgical evaluation and can assist the surgical strategy. Furthermore, the investigators consider as open issues worth to be explored the optimization of the model’s related parameters, the selection of the most appropriate surface features and the enhancement of the algorithm’s efficiency.
