Task 1: Improve Data Augmentation (DA) of a limited training set of 18F-Florbetaben (18F-FBB) PET images by synthesizing additional realistic 18F-FBB PET images using a Conditional Generative Adversarial Network (CGAN) (model #1) and subsequently evaluating the similarity/realism of the synthetic training data compared to real training data
Task 2: Utilize the augmented training set of 18F-FBB PET images to enhance classification of Amyloid-beta (Αβ) plaque distributions in 18F-FBB PET Images using a Machine learning-based Support Vector Machine/Neural Network (SVN/NN) classifier (model #2 or target model)
Description: This study employs multiple Machine Learning (ML) and Artificial Intelligence (AI) models to perform the two tasks above. The first objective is the implementation and performance evaluation of a conditional GAN (CGAN) model based on (i) the deep convolutional GAN (DCGAN) model introduced by Radford et al. and (ii) the improved training method of Wasserstein GANs (WGANs) with a Gradient Penalty term (WGAN-GP, its Keras implementation) introduced by Gulrajani et al. to augment a limited training dataset of 18F-FBB human brain PET images targeting the Αβ plaque distribution in brain tissue. This objective also includes the quantitative evaluation of the level of similarity/realism of the synthetic 18F-FBB PET images in comparison to the real 18F-FBB images in the limited training dataset to to improve the generalization performance of the learning process of the target AI-classification model of the second objective below.
The second objective involves the assessment of the augmented training dataset for improving the classification of the 18F-FBB PET images as Αβ positive or negative relative to just using the non-augmented initial training dataset. For this classification task, another AI framework was implemented: the well-known DenseNet121 CNN model (Keras implementation) introduced by Huang et al was first applied for the features extraction, followed by a Support Vector Machine and a Neural Network (SVM/NN) as classifiers.
Overall the data augmentation, evaluation of augmented quality of training data and classification performance enhancement framework proposed by the authors of the reference study includes:
- a conditional WGAN-GP to learn each axial image distribution extracted from pre-processed 3D 18F-FBB PET images,
- a pre-trained DenseNet121 coupled with model-agnostic metrics to visually and quantitatively measure the similarity and realism of the generated images in comparison to the original images, and
- ML models such as support vector machine (SVM) and neural network (NN) for observing the generalization performance after the use of the CGAN-generated images for DA.
Experiment: The data flow diagram of the figure below illustrates the process of obtaining GAN to improve the target model using augmented FBB amyloid brain PET image data and measuring the reality of the generated data and its suitability for use in data augmentation.
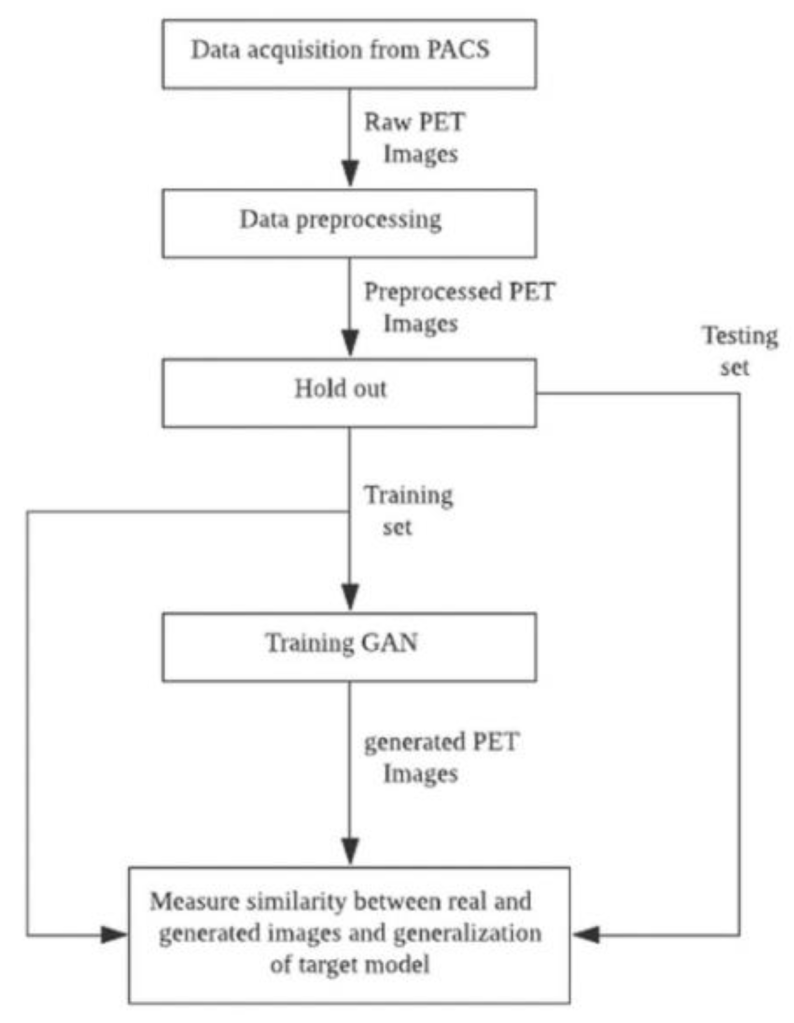
First, raw PET images obtained from a PACS running at DAUH undergo pre-processing. The pre-processed images were examined, and 3D images from patients that were Aβ negative or Aβ positive were divided using a 1:1 ratio into training and test sets. The training set was used to select and train GAN models that generated images of both groups. In this experiment, the similarity between the images generated from the trained GAN model and the real images was evaluated using a Visual Turing test, distribution with t-SNE, and 3 quantitative metrics. The metrics selected to measure a similarity of a given data distribution in this experiment used recently reported model-agnostic GAN evaluation metrics including Maximum mean discrepancy (MMD), Fréchet inception distance (FID), and The 1-nearest neighbor classifier (1-NN) leave-one-out (LOO) accuracy instead of traditional approaches in which the their limits are reported. The generalization performance of the target AI-classification model was assessed by comparing the performance of the target model that was trained using only the training set with the augmented target model that was trained using both the training and the CGAN-generated sets.
The tool used in this experiment was written using Python 3.6.9 (Python Software Foundation, Wilmington, DE, USA), and Keras 2.2.4, and OpenCV 4.1.2.30 libraries were mainly used. The DenseNet model was used as a feature extractor, and finetuned weights were provided by the Keras library.
Target AI-classification model: In this experiment, a standard target classifier for 18F-FBB PET images is employed to assess the effectiveness of GAN-based Data Augmentation with visual and quantitative similarity. Therefore, the object classifier used in this experiment consists of a feature extractor to reduce features from the 2D axial plane and a classifier to predict the Aβ distribution from the extracted features. More specifically, the DenseNet, a well-known convolutional neural network (CNN) structure, will be used as the feature extractor, while the support vector machine (SVM) and a neural network (NN) will be employed as the classifiers. The figure below shows the simplified structure of the target model used in the reference study’s experiment.
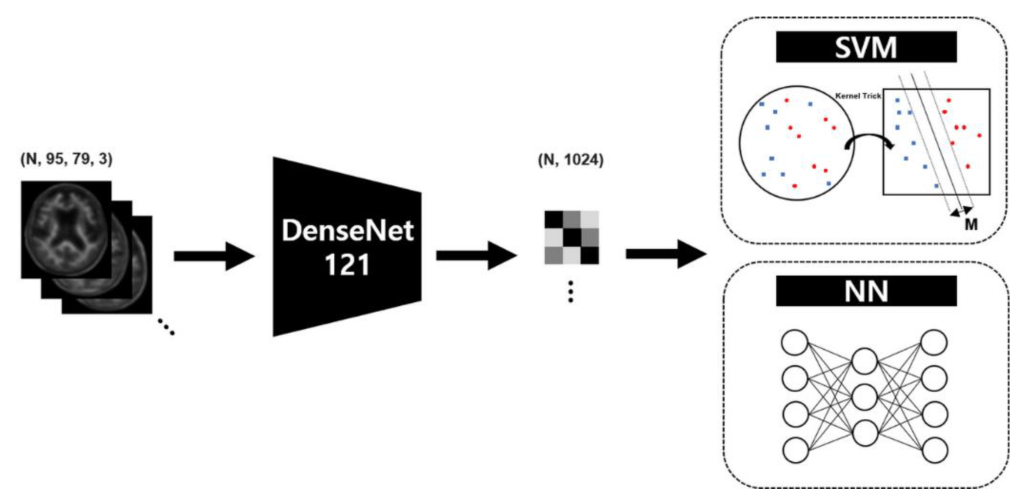
Transfer learning is a technique that applies a model that has learned data in a specific field to similar or completely different fields, and is used in medical image classification using DL-based classifiers to report interesting results. It is a way to reuse the weights of a finetuned CNN model that are mostly trained with ImageNet datasets. Although the input of the target model was FBB PET images which is originally a gray scale version of a real PET image, the channels of the input data were transformed into a color channel using the OpenCV-python library to match the channel size of the finetuned DenseNet model for a continuity and reproducibility of previous studies.
Target model training and model selection validation were performed using 4-fold nested cross-validation and Bayesian optimization for SVM. The search space for hyper-parameters for SVM was set to (Linear, RBF, Poly) for kernel function, [1, 100] for C, [0.0001, 0.1] for gamma. The NN features were deterministically set to 3 hidden layers with 128,128, and 64 nodes, respectively; Adam optimizer with β1 = 0.9, β2 = 0.999, and without decay; 300 epochs; and learning rate 0.00005.
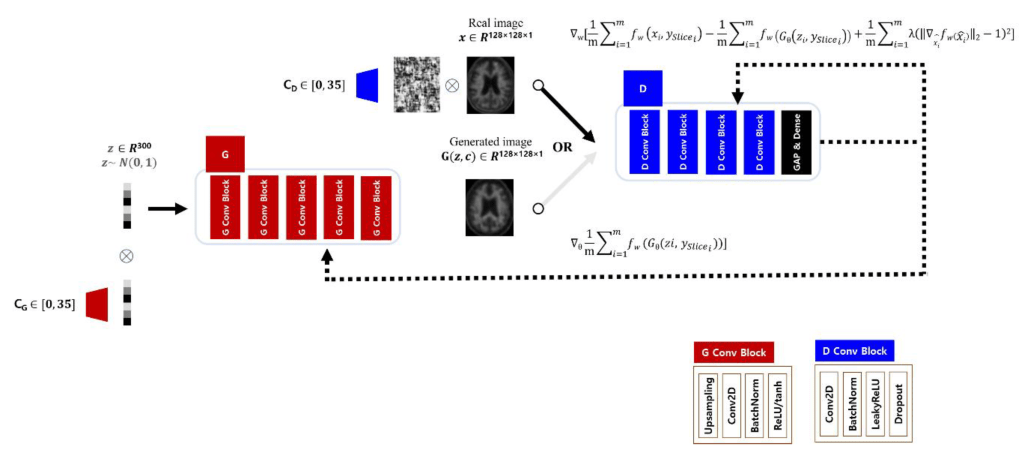
Generative Adversarial Network for Data Augmentation: The selected target classifier performs inferences on the 2D axial images, while the prediction for the Aβ distribution for a subject should reflect the 36 axial planes placed on the transverse axis. Therefore, to assist the target classifier, the GAN model must understand all of the Aβ deposition patterns for the 36 axial plane levels, with the anatomical information matched to each level. Thus, the structure of the discriminator and generator of the Deep Convolutional Generative Adversarial Network (DCGAN) was adopted to learn and infer the Aβ deposition patterns on a axial plane level, and trained each of the axial levels from 0 to 35 to which the input image belongs using additional condition labels (conditional GAN, CGAN). Repeatedly stacked blocks were used to construct a network structure for both generator and discriminator, and the inputs for each module multiplied by the encoded vector for each axial level label stored in an embedding matrix and then entered the stacked network.
A generator produced an image from a noise vector of size 300 sampled from a normal distribution, and a discriminator estimated a score for the similarity of the two distributions from real and generated images as a critic. The generator consisted of first hidden layer with 8192 nodes connected to the noise vector, and 5 layers of blocks which had up-sampling, convolution, batch normalization, and activation function. The activation function of the last block was tanh instead of ReLU which other blocks had.
The discriminator had 4 layers of blocks which had convolution, batch normalization, leaky ReLU (α = 0.2), and dropout layer (p = 0.25). And a global average pooling and a dense layer followed the blocks ahead. The structure of the GAN model used in this experiment is shown in the figure below:
The GAN learns a function that connects the target distribution directly from the input distribution without any estimation of the probability density function for the target domain. GAN has a mechanism in which the two models, Generator G and Discriminator D, learn from each other competitively. Discriminator D predicts the probability that the received data belongs to the real distribution.
The aim of GANs is to obtain a generative model that produces a synthetic (fake) distribution that is sufficiently close to the real distribution. In the previously reported WGAN scheme, a weight clipping method was used to simply implement a Discriminator following the 1-Lipschitz constraint with a gradient between two points less than 1. Gradient penalty (GP) loss was then proposed to reduce the length of time needed to reach an optimality when the weights are too large or too small. Thus, the model can be challenged to satisfy the constraints by adding a regularization (i.e. a gradient penalty) term to the Wasserstein loss so that the gradient norm is 1 through the weighted average between the points sampled from the synthetic and real distributions.
To augment Aβ negative and positive images for each class, the GAN model was constructed as two independent models, and the generated images were used as training data for the AI-classification target model to improve the generalization.
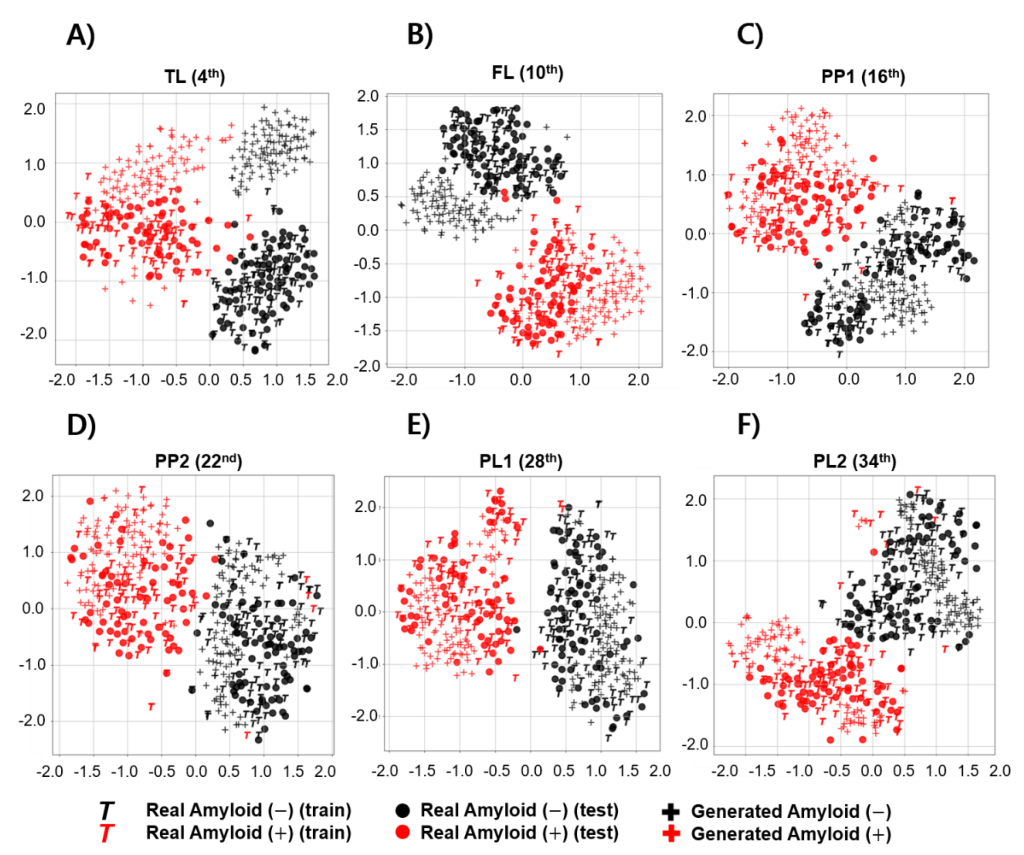
Performance metrics: Visual and quantitative metrics were used to evaluate the degree of similarity between the images generated by the generator and the test set. The generated images were visually evaluated by comparing them with real images in test set using the Visual Turing test and observing the distribution of image features using the t-SNE.
In the quantitative evaluation, features were extracted from the image, and the similarity between the extracted feature distributions was measured using 3 model-agnostic metrics.
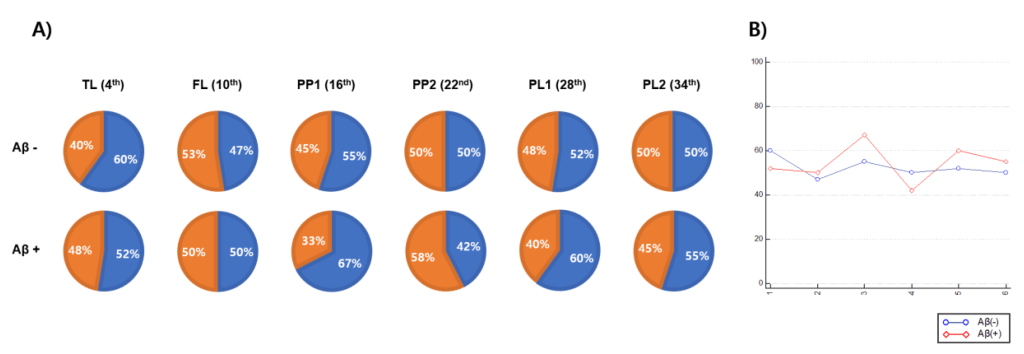
All feature extraction processes were performed using the finetuned DenseNet121 model. Because each image contained many slices, representative images were selected at equal intervals from all 36 images at low levels (beginning in the region where the cerebellum was observed). Six representative axial planes were selected to cover the four brain regions required by the Brain Amyloid Plaque Load (BAPL) scoring system.
Results: The Visual Turing test showed similarity in the descriptions of typical patterns of amyloid deposition for each of the generated images. However, differences in similarity and classification performance per axial level were observed, which did not agree with the visual evaluation. Experimental results demonstrated that quantitative measurements were able to detect the similarity between two distributions and observe mode collapse better than the Visual Turing test and t-SNE.
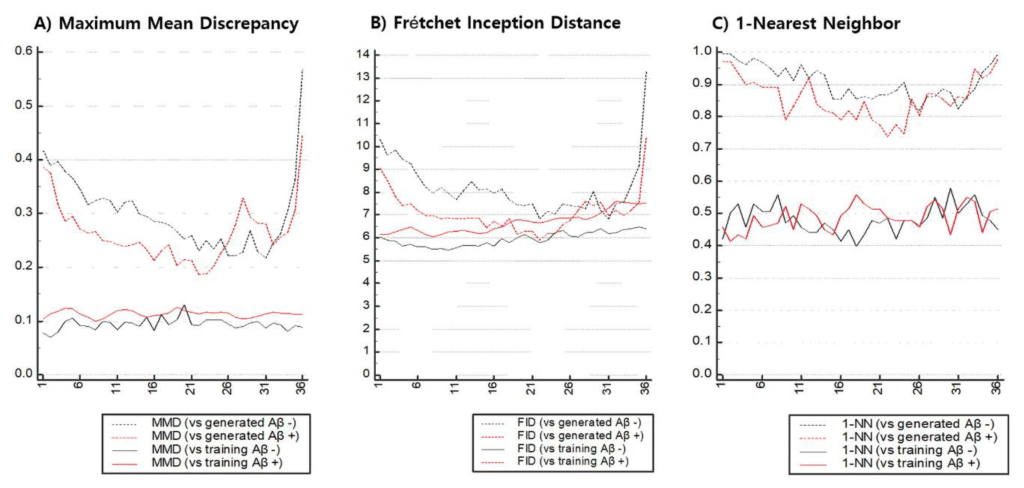
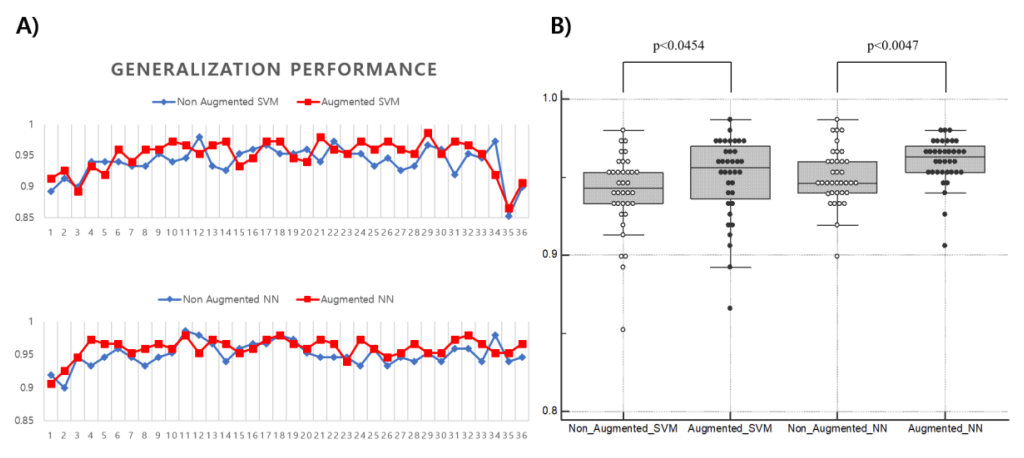
Claims: 18F-Florbetaben Aβ PET images were synthesized using GAN from a limited set of real 18F-FBB PET images and then visually and quantitatively evaluated against the real Αβ PET images. The similarity of the images that could statistically augment Aβ images was quantitatively measured for Aβ-negative (MMD:0.2284, FID:6.8253, 1-NN LOO accuracy:0.8562) and positive images (MMD:0.01865, FID:5.8919, 1-NN LOO accuracy:0.6233). By using the augmented dataset of real and synthetic Αβ PET images as training data, an enhanced SVM/NN-based classifier performance was attained for the Αβ PET images (median-SVM, 0.943–0.956, median-NN, 0.946–0.963). The experimental results demonstrated that quantitative measurements were able to detect the similarity between the two (real vs. synthetic) distributions and to observe mode collapse better than the Visual Turing test and t-SNE.
GitHub Code Repository for evaluation of CGAN model performance for training Data Augmentation to enhance 18F-FBB PET Image classification for Αβ-PET imaging.
- Reference Publication for Evaluation of CGAN-based Data Augmentation framework for enhanced 18F-FBB PET Image Classification
- Model #1 (DCGAN and WGAN-GP) GitHub Pages
- DCGAN and WGAN Reference Publications:
- Model #2 (SVM/NN classifier) GitHub Page
- DenseNet (densely-connected CNN) Model for classification problems
- DenseNet121 Keras implementation
- SVM/NN Classifier Reference Publications
